A Window into the Aquifers
A powerful computational window into the aquifers beneath the southern Nebraska Panhandle
Imagine having a sophisticated virtual replica of the entire underground water system that sustains our region. The Ground Water Model does exactly that — it uses advanced mathematics and decades of real-world data to simulate how water moves through aquifers, interacts with rivers and canals, responds to pumping, and evolves over time.
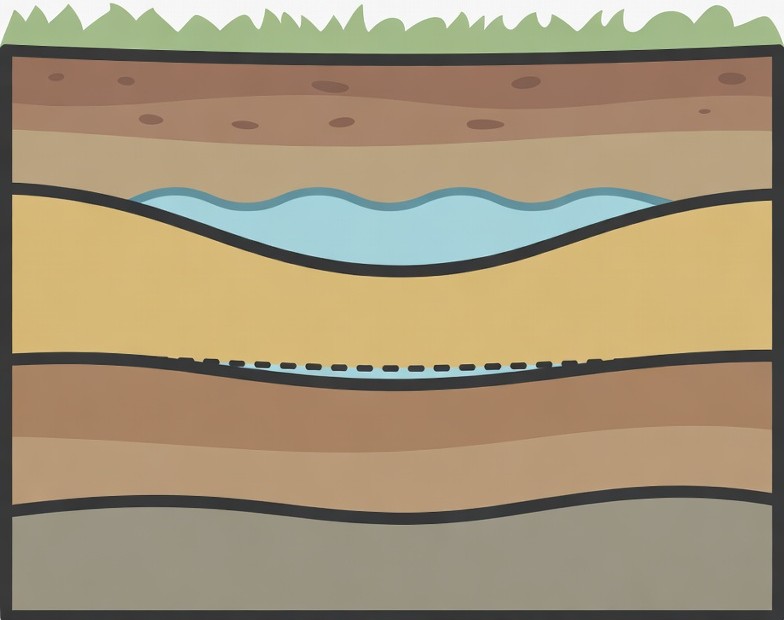
A ground water model is a sophisticated computer simulation that acts as a virtual replica of the real underground water system. It uses mathematical equations and real-world data—such as the area's hydrogeology, water levels from wells, stream flows, pumping records, and weather patterns—to represent how ground water moves through aquifers made of saturated sediment and rock.
Think of it like a high-tech video game for the aquifer: scientists and water managers can run “what if” scenarios to test how pumping, irrigation, rainfall, or future changes might affect water levels and stream flows—without ever touching the actual system. The WWUMM model is built using the latest USGS MODFLOW 6 technology, the international standard for these kinds of simulations. It helps us predict, plan, and protect our ground water for years to come!
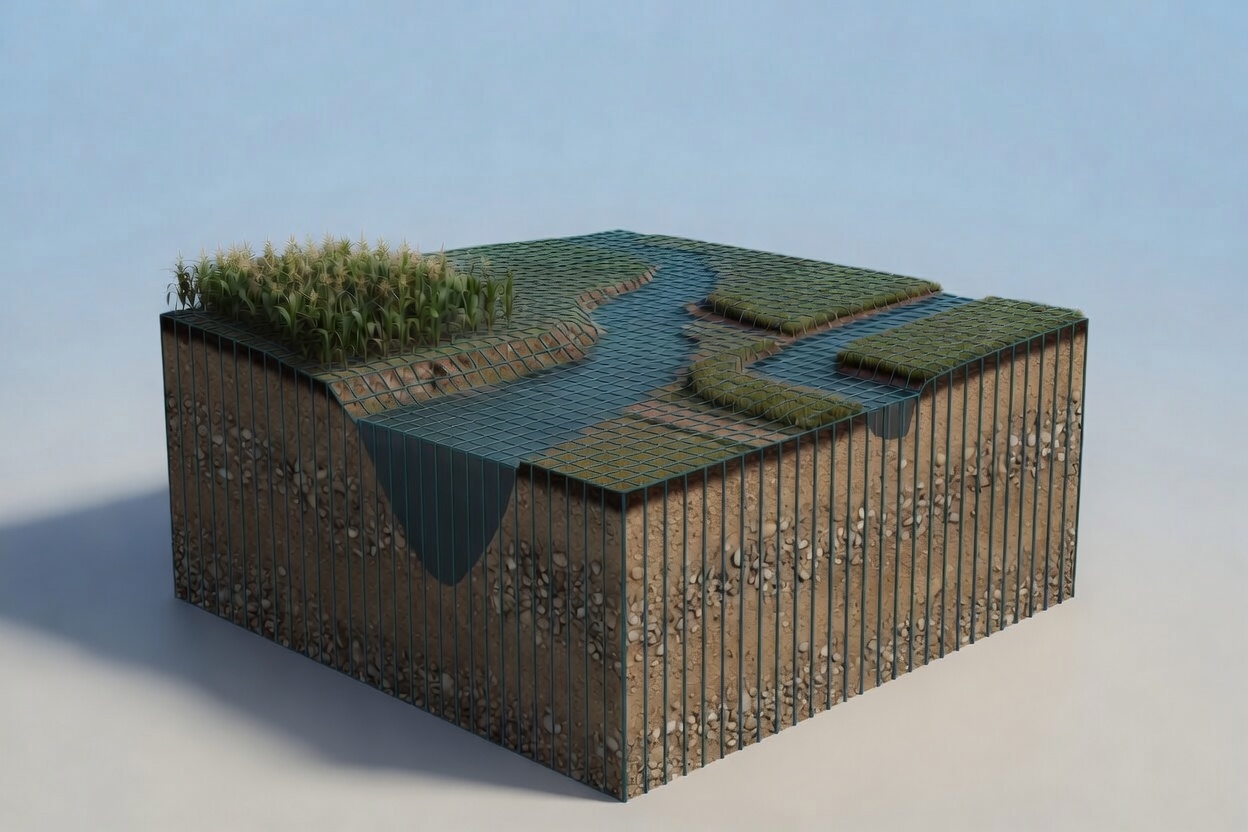
Simple 3D schematic of a ground water model. The WWUMM model works just like this — only on a much larger, data-driven scale across the entire Southern Nebraska Panhandle.
The southern Panhandle sits atop a complex aquifer system connected to the North Platte and South Platte rivers, countless streams, canals, and rainfall. Water managers in NPNRD and SPNRD, along with our partners at the Nebraska Department of Water, Energy, and Environment, needed a way to understand how pumping, irrigation, weather, and surface water interact with the aquifers over time. In its current form, the ground water model simulates the entire ground water system from January 1953 through December 2025, giving districts an unprecedented view of how the aquifer has responded to real-world conditions over seven decades.
This is more than just a computer program—it’s a dynamic, science-based representation of the aquifer beneath our feet, built specifically to help NPNRD and SPNRD make informed decisions for long-term water management and security.
The model allows water managers to test "what if" scenarios: What happens if we pump more in a particular area? How will climate change affect recharge? How do different irrigation practices impact stream flows? These insights are critical for balancing agricultural needs with long-term aquifer sustainability.
A single-layer MODFLOW model of the High Plains aquifer covering ~11,100 square miles.
The WWUMM Ground Water Model is a regional, one-layer numerical simulation of the High Plains aquifer—the primary water-bearing system in the southern Nebraska Panhandle. This single layer effectively combines multiple geologic units into one unified aquifer, including the saturated portions of the Ogallala Group, the fractured Brule Formation (with its natural fractures, voids, and alluvial channel deposits), the Arikaree Group, and Quaternary alluvial deposits in the river valleys.
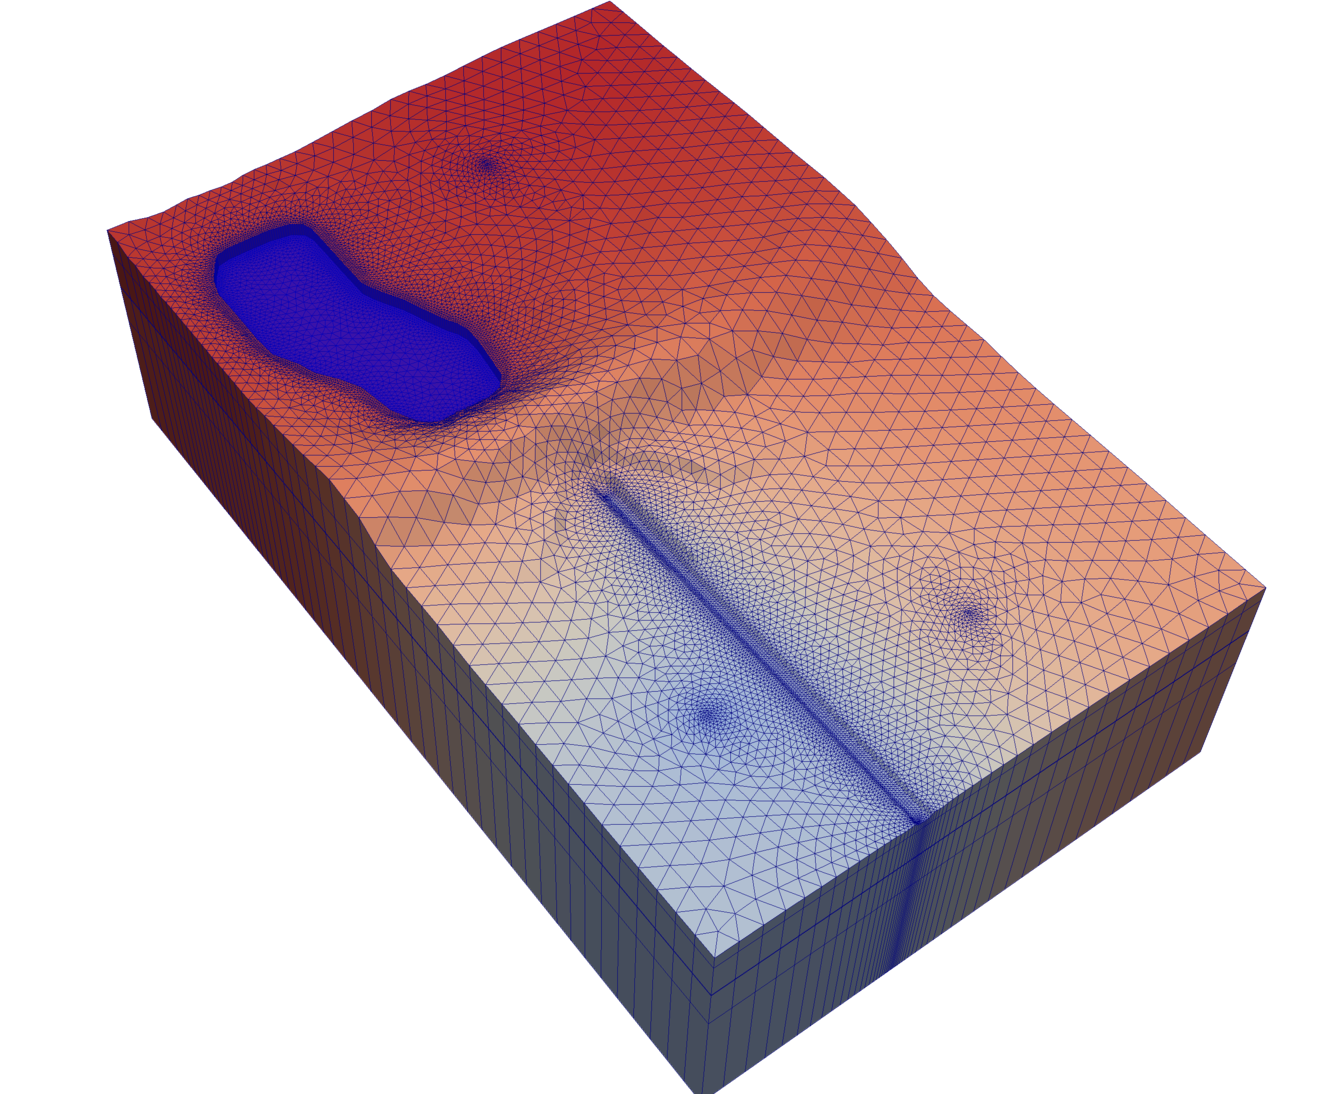
The model covers approximately 11,100 square miles and divides the landscape into a detailed grid of rectangular cells (each 40 acres). Within every cell, it calculates how ground water flows based on aquifer properties such as hydraulic conductivity and specific yield. Rivers and streams are represented with special “stream cells” that dynamically simulate the exchange of water between the aquifer and surface water—allowing the model to accurately show gaining and losing reaches along the North Platte River, South Platte River, Lodgepole Creek, Pumpkin Creek, Blue Creek, and their tributaries.
It also accounts for key real-world processes: recharge from rangeland, dryland crops, surface-water irrigation (including canal seepage), and ground-water irrigation; discharge through evapotranspiration in areas where the water table is near the land surface (such as the Sand Hills); springs; and well pumping for irrigation, municipal, and other uses. The model runs in two main parts—a steady-state simulation of pre-development conditions followed by a transient simulation that tracks month-by-month changes from 1953 onward—then carefully calibrated against real observed water levels and stream baseflow measurements.
This strong scientific foundation is what later updates built upon, making the current model even more accurate, stable, and ready for the future.
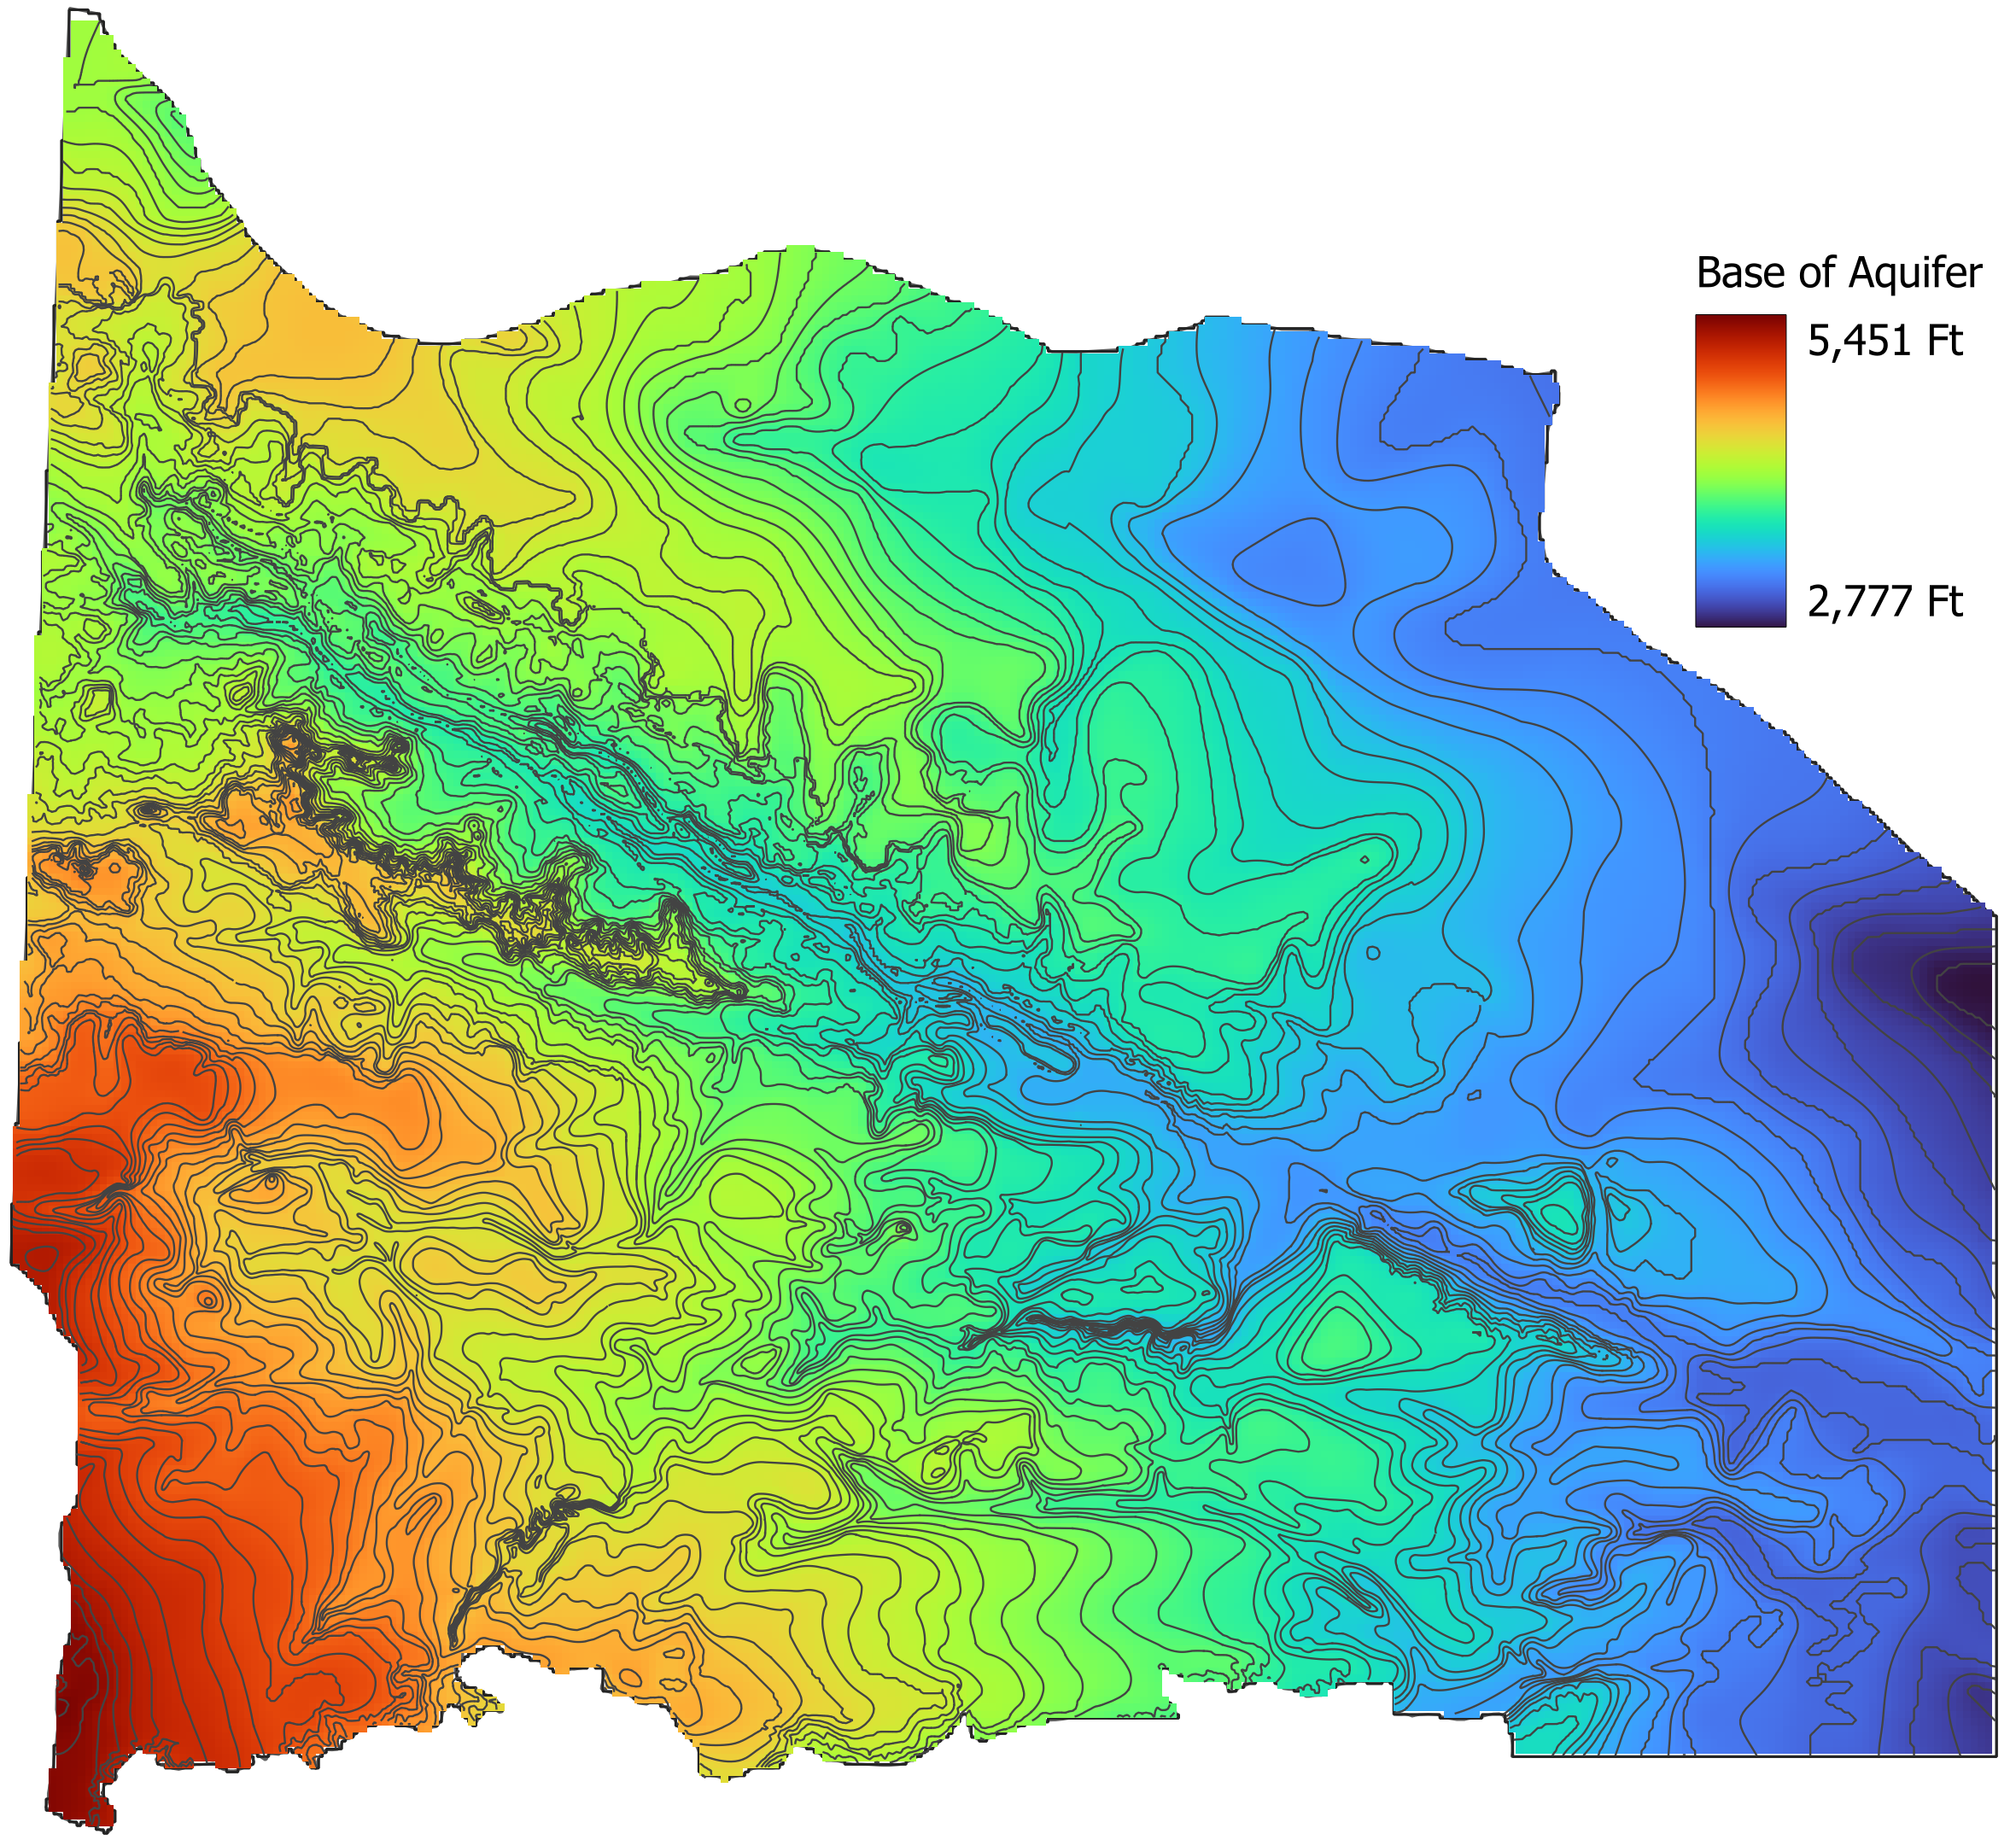
The 2017-2020 Hydrogeology of Western Nebraska study dramatically improved our understanding of the aquifer's base. This landmark work (featured on the Hydrogeology page) provided the refined base-of-aquifer surface that powers the current WWUMM model's accuracy. The two efforts work hand-in-hand — the hydrogeologic understanding informs the model, and the model helps us apply that knowledge to real-world water management decisions.
The model has been completely modernized with major advancements that make it more accurate, stable, and powerful than ever before.
The entire model now runs on the latest USGS MODFLOW 6 engine. This brings faster, more stable simulations and better handling of the complex interactions between ground water, streams, wells, and drains—exactly what NPNRD and SPNRD need for reliable results.
One of the biggest improvements addresses the aquifer’s bottom boundary or base. By integrating the latest Hydrogeology of Western Nebraska data and carefully mapping Brule Formation fractures, the model gives the districts a much clearer picture of ground water movement.
The model’s surface now uses the latest 1-meter LiDAR elevation data from the USGS 3DEP program. Every cell knows the exact land surface elevation, which dramatically improves evapotranspiration calculations and predictions of flooded areas.
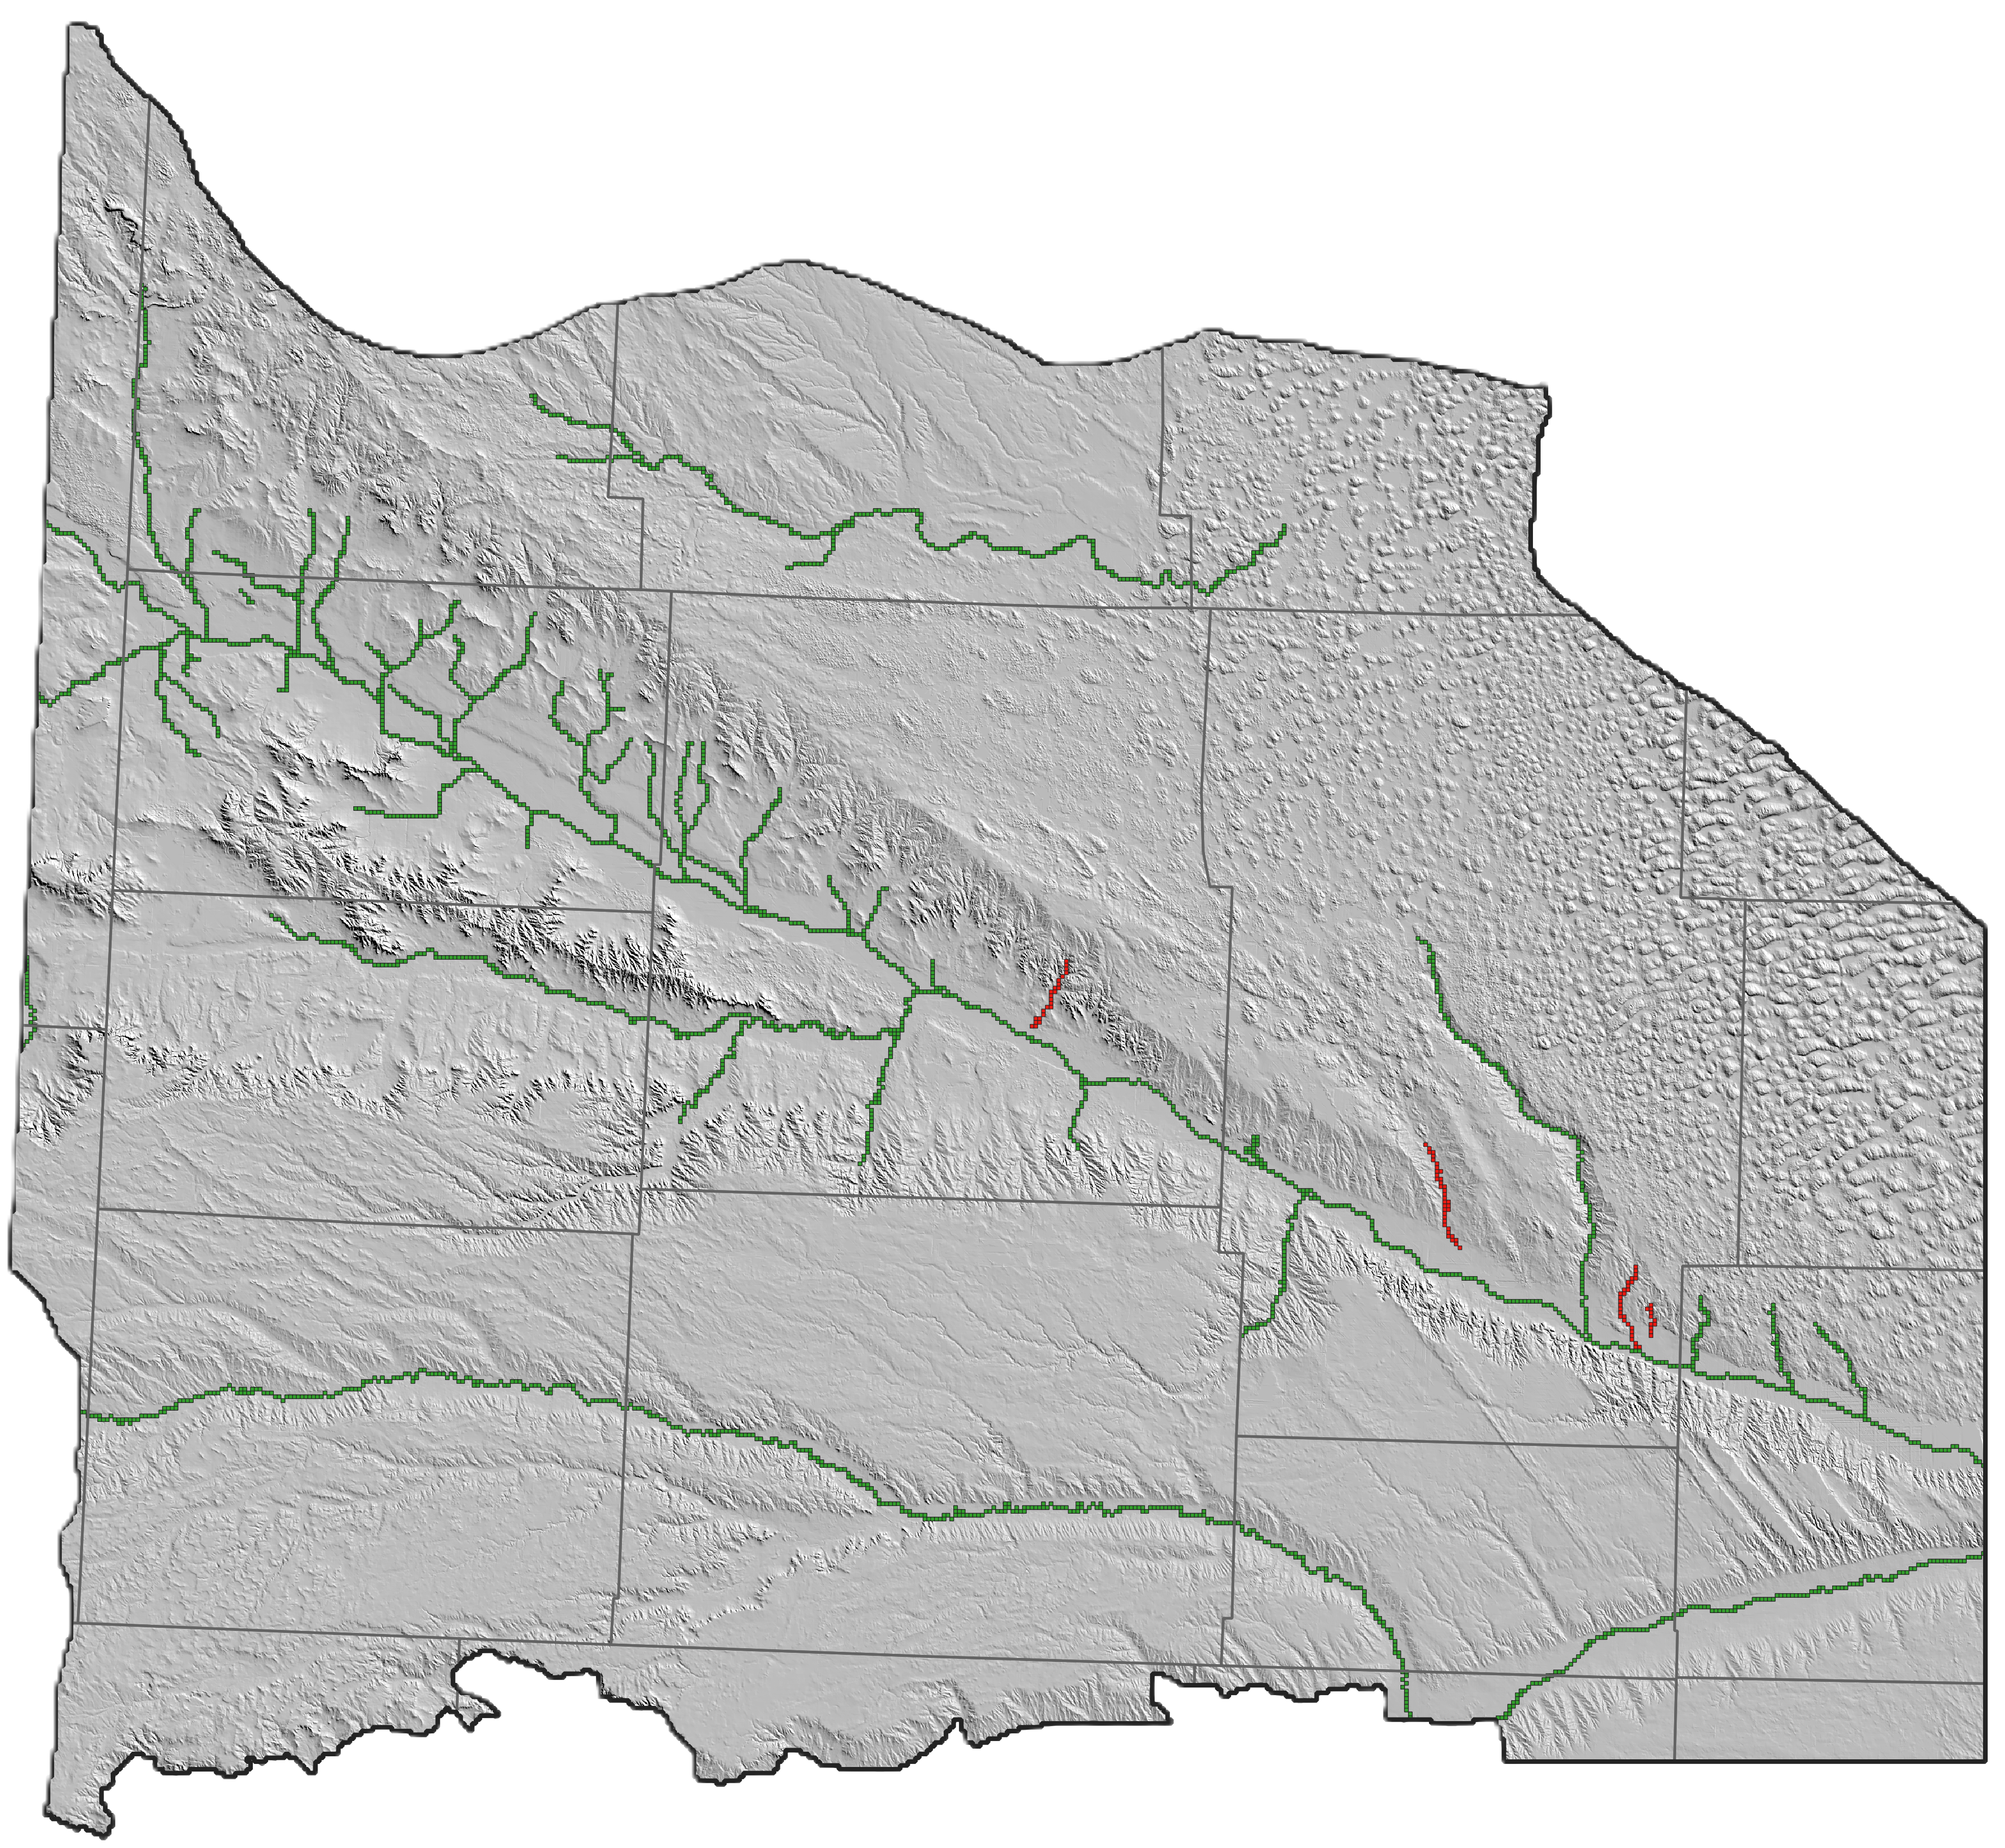
The stream network has been upgraded to the modern SFR package, with four new tributaries added. New drains in the southern model area now accurately represent natural springs, eliminating previous flooding issues.
Well pumping and aquifer recharge files are generated directly from the Enhanced Soil and Crop (ESC) model.
Water-level and stream baseflow targets have been extended through 2025. The model matches 131 water-level observation sites with a mean residual of just +1.8 feet.
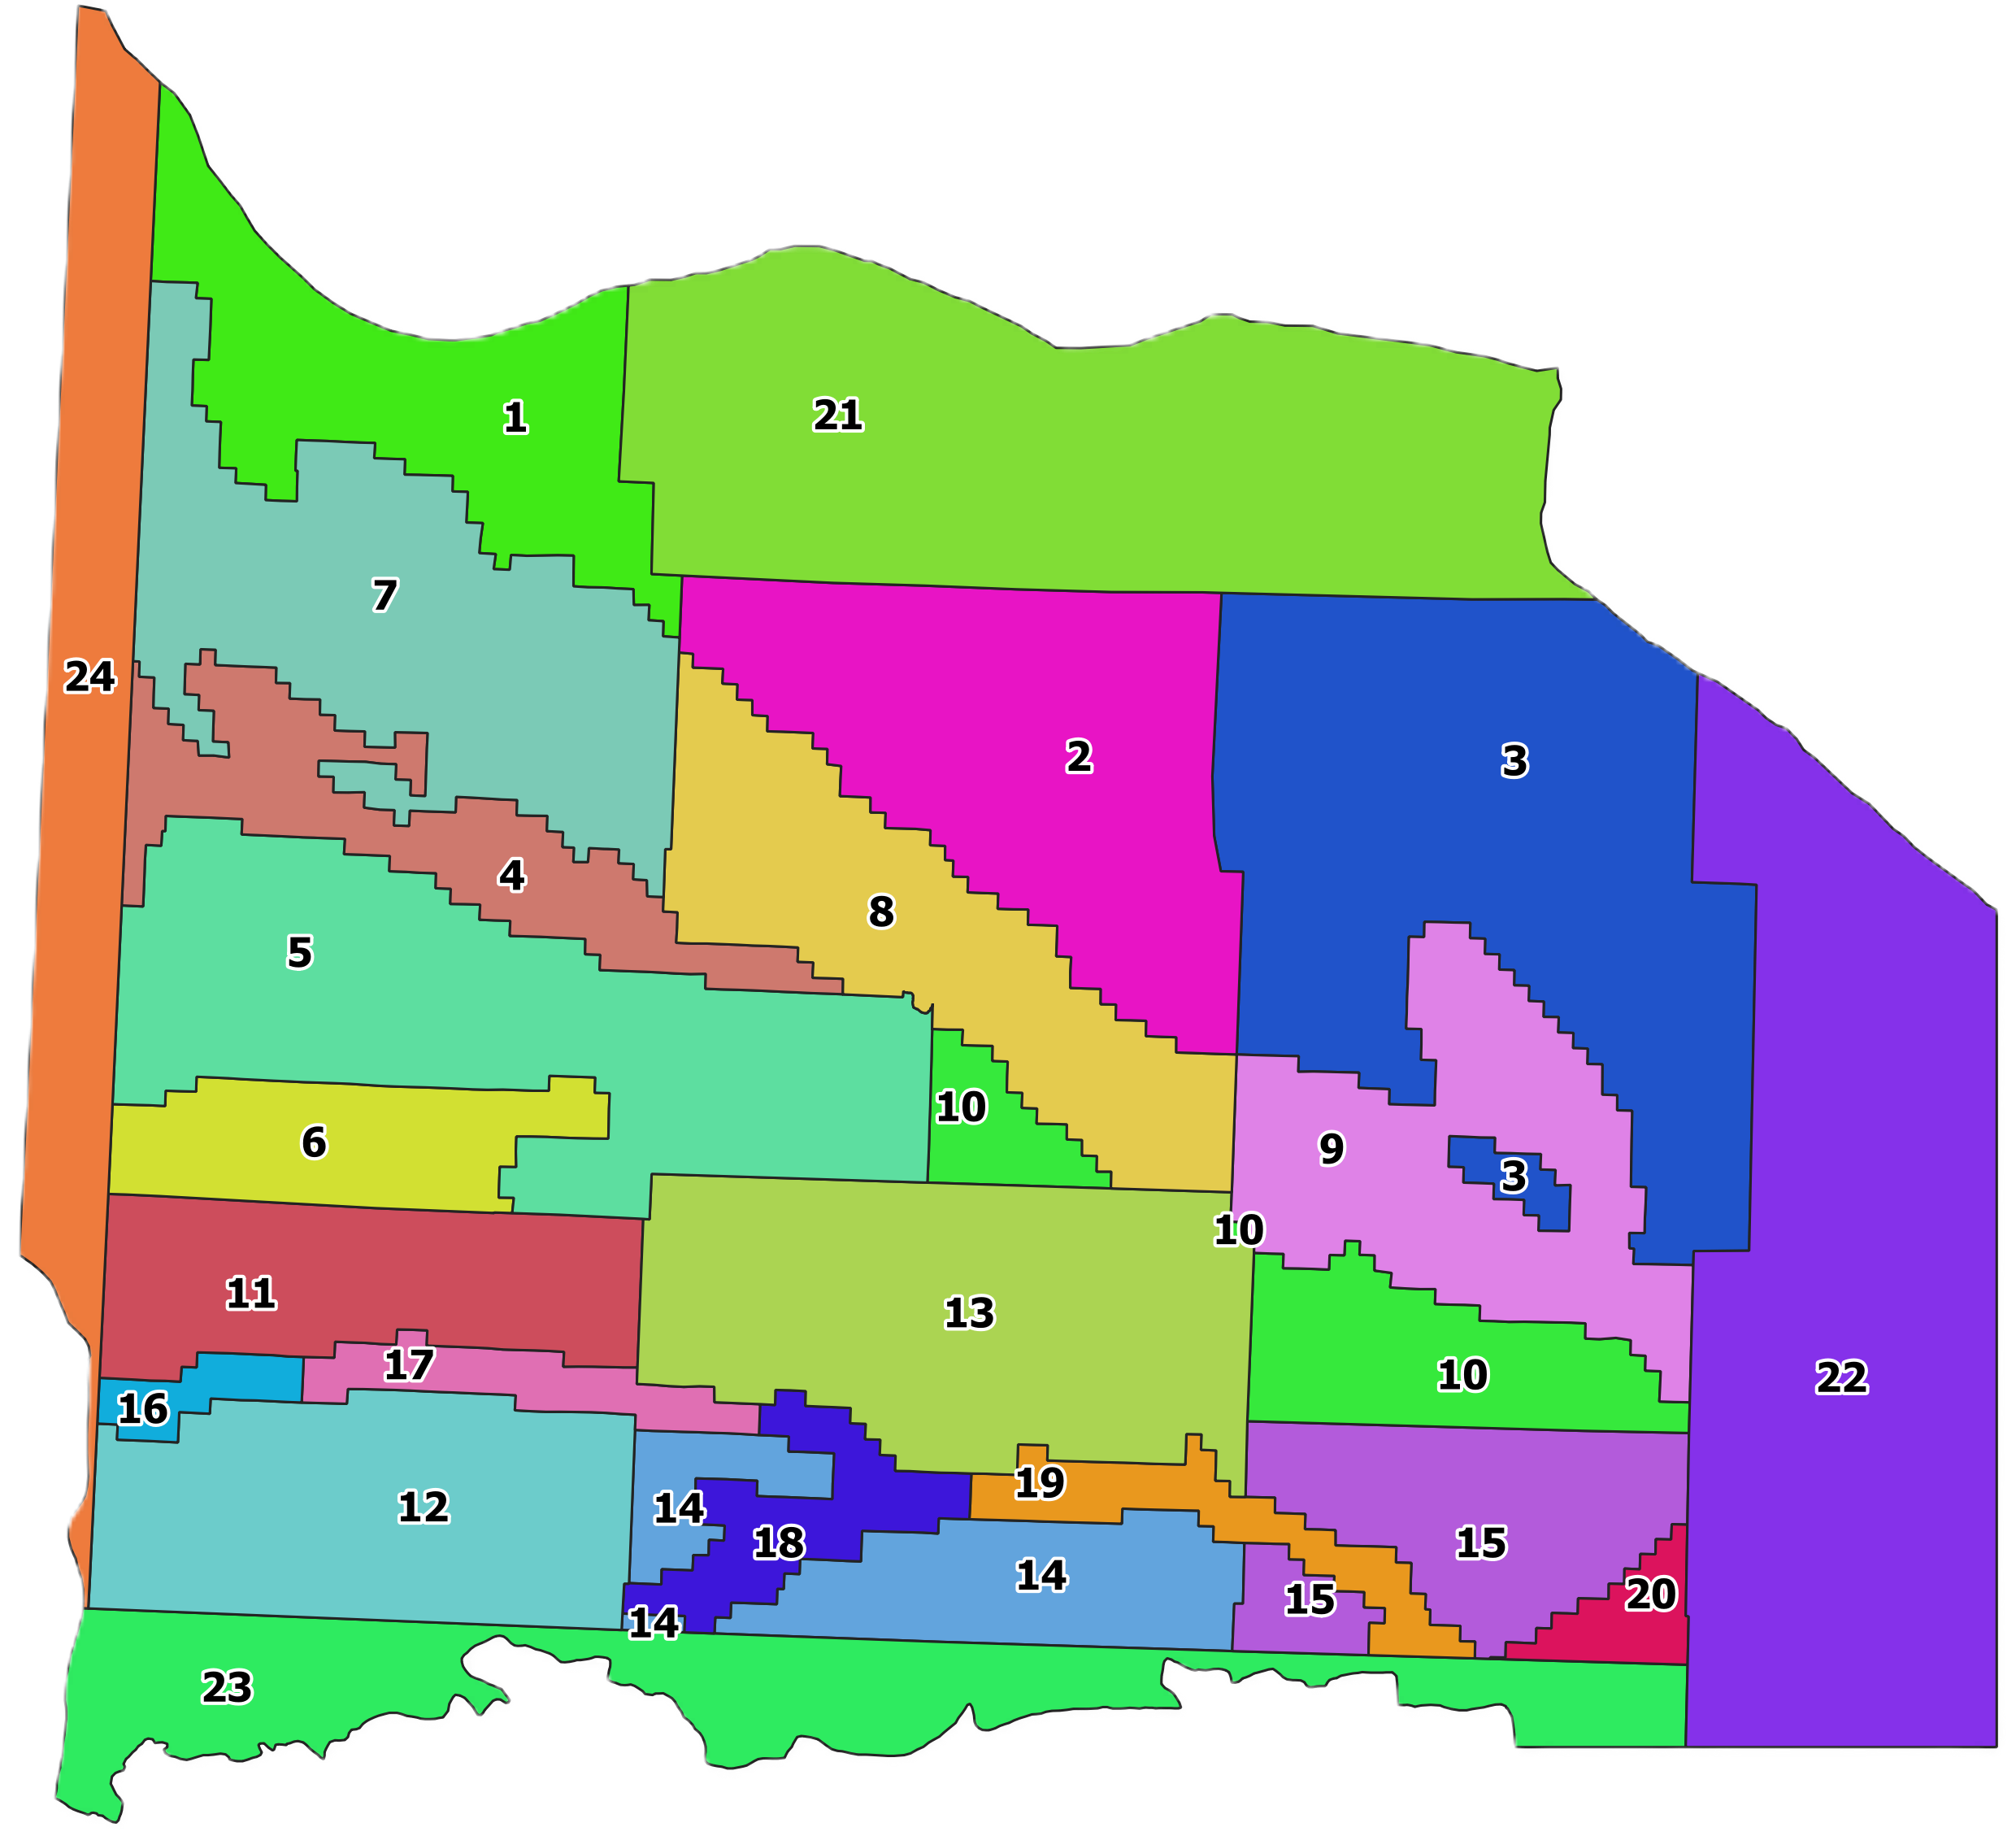
To provide even greater usefulness for NPNRD and SPNRD, the model divides the entire study area into 24 distinct zonal areas. These zones are thoughtfully defined based on real differences in hydrology, hydrogeology, NRD and county boundaries, and areas outside the main districts (including parts of Wyoming and Colorado).
This zonal approach lets water managers zoom in on specific regions—such as different segments of the North Platte River Valley, the South Tablelands (Cheyenne and Peetz Tablelands), the Pumpkin Creek Basin, various reaches of Lodgepole Creek and Sidney Draw, the Wildcat Hills, the Sand Hills, the Northern (Alliance) Tableland, and more. Some zones focus on “FA” (Fully Appropriated) areas while others cover “OA” (Overappropriated) areas, allowing precise tracking of pumping volumes, recharge rates, water-level changes, and model performance in each unique part of the Panhandle.
By breaking the big picture into these manageable zones, the model delivers targeted insights that help districts understand exactly what’s happening in their most important agricultural and environmental areas.
Map showing the 24 distinct zonal areas used in the model for targeted analysis across the southern Panhandle.
| Zone | Description |
|---|---|
| 1 | FA Area in Southern Sioux and Northern Scotts Bluff Counties (NPNRD) |
| 2 | FA Area in Northern Morrill County (NPNRD) |
| 3 | FA Area in Northern Garden County (NPNRD) |
| 4 | FA Area (Wildcat Hills) in Southern Scotts Bluff, Southern Morrill, and Northern Banner Counties |
| 5 | OA Area of the Pumpkin Creek Basin (NPNRD) |
| 6 | FA Area of the South Tablelands in Banner County (NPNRD) |
| 7 | OA Area of the North Platte River Valley in Scotts Bluff County (NPNRD) |
| 8 | OA Area of the North Platte River Valley in Morrill County (NPNRD) |
| 9 | OA Area of the North Platte River Valley in Garden County (NPNRD) |
| 10 | FA Area of the South Tablelands in Morrill and Garden Counties (NPNRD) |
| 11 | FA Area of the South Tablelands in Northern Kimball County (SPNRD) |
| 12 | FA Area of the South Tablelands in Southern Kimball County (SPNRD) |
| 13 | FA Area of the South Tablelands in Northern Cheyenne County (SPNRD) |
| 14 | FA Area of the South Tablelands in Southern Cheyenne County (SPNRD) |
| 15 | FA Area of the South Tablelands in Deuel County (SPNRD) |
| 16 | OA Area of Lodgepole Creek West of Oliver Reservoir (SPNRD) |
| 17 | OA Area of Lodgepole Creek East of Oliver Reservoir to Buffalo Bend (SPNRD) |
| 18 | OA Area of Lodgepole Creek East of Buffalo Bend to Sidney, including Sidney Draw (SPNRD) |
| 19 | OA Area of Lodgepole Creek East of Sidney to the Colorado State Line (SPNRD) |
| 20 | OA Area of the South Platte River Valley (SPNRD) |
| 21 | Upper Niobara White NRD Area |
| 22 | COHYST Modeling Area |
| 23 | South Tablelands of Colorado Area |
| 24 | Wyoming Area |
FA = Fully Appropriated • OA = Overappropriated. These zones enable precise, region-specific analysis of pumping, recharge, water levels, and model calibration across the entire study area. Scroll the table to see zones 6–24.
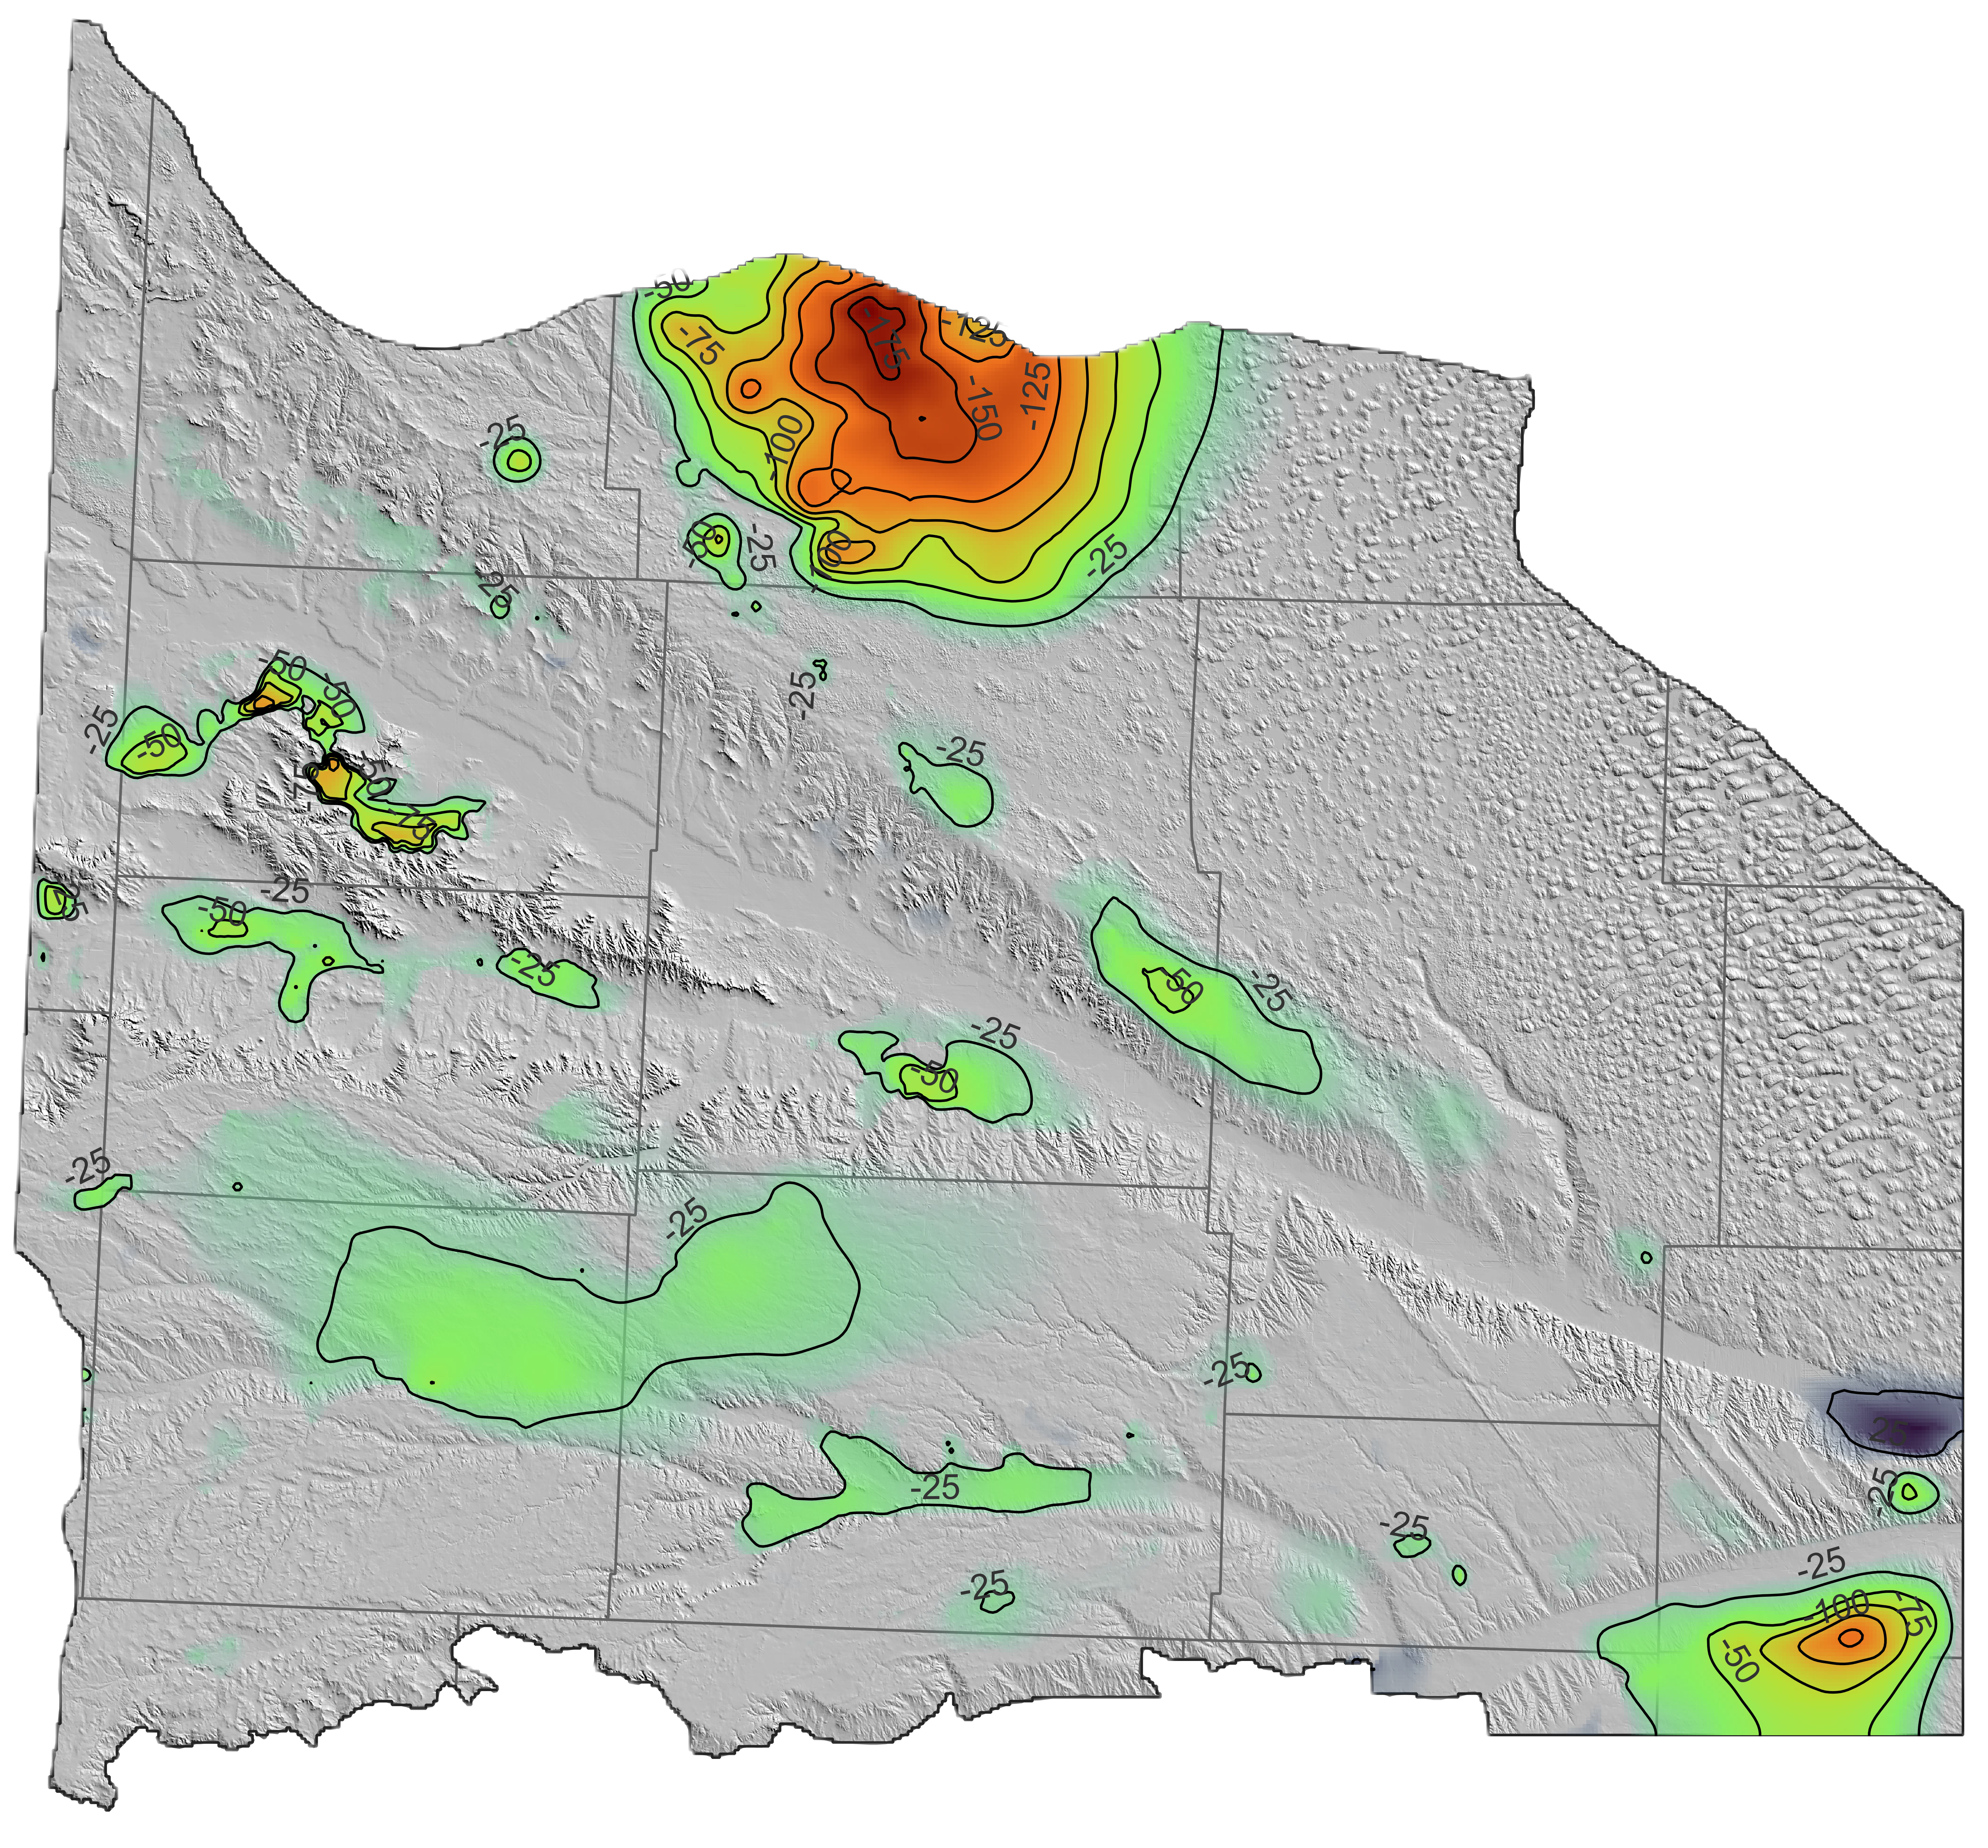
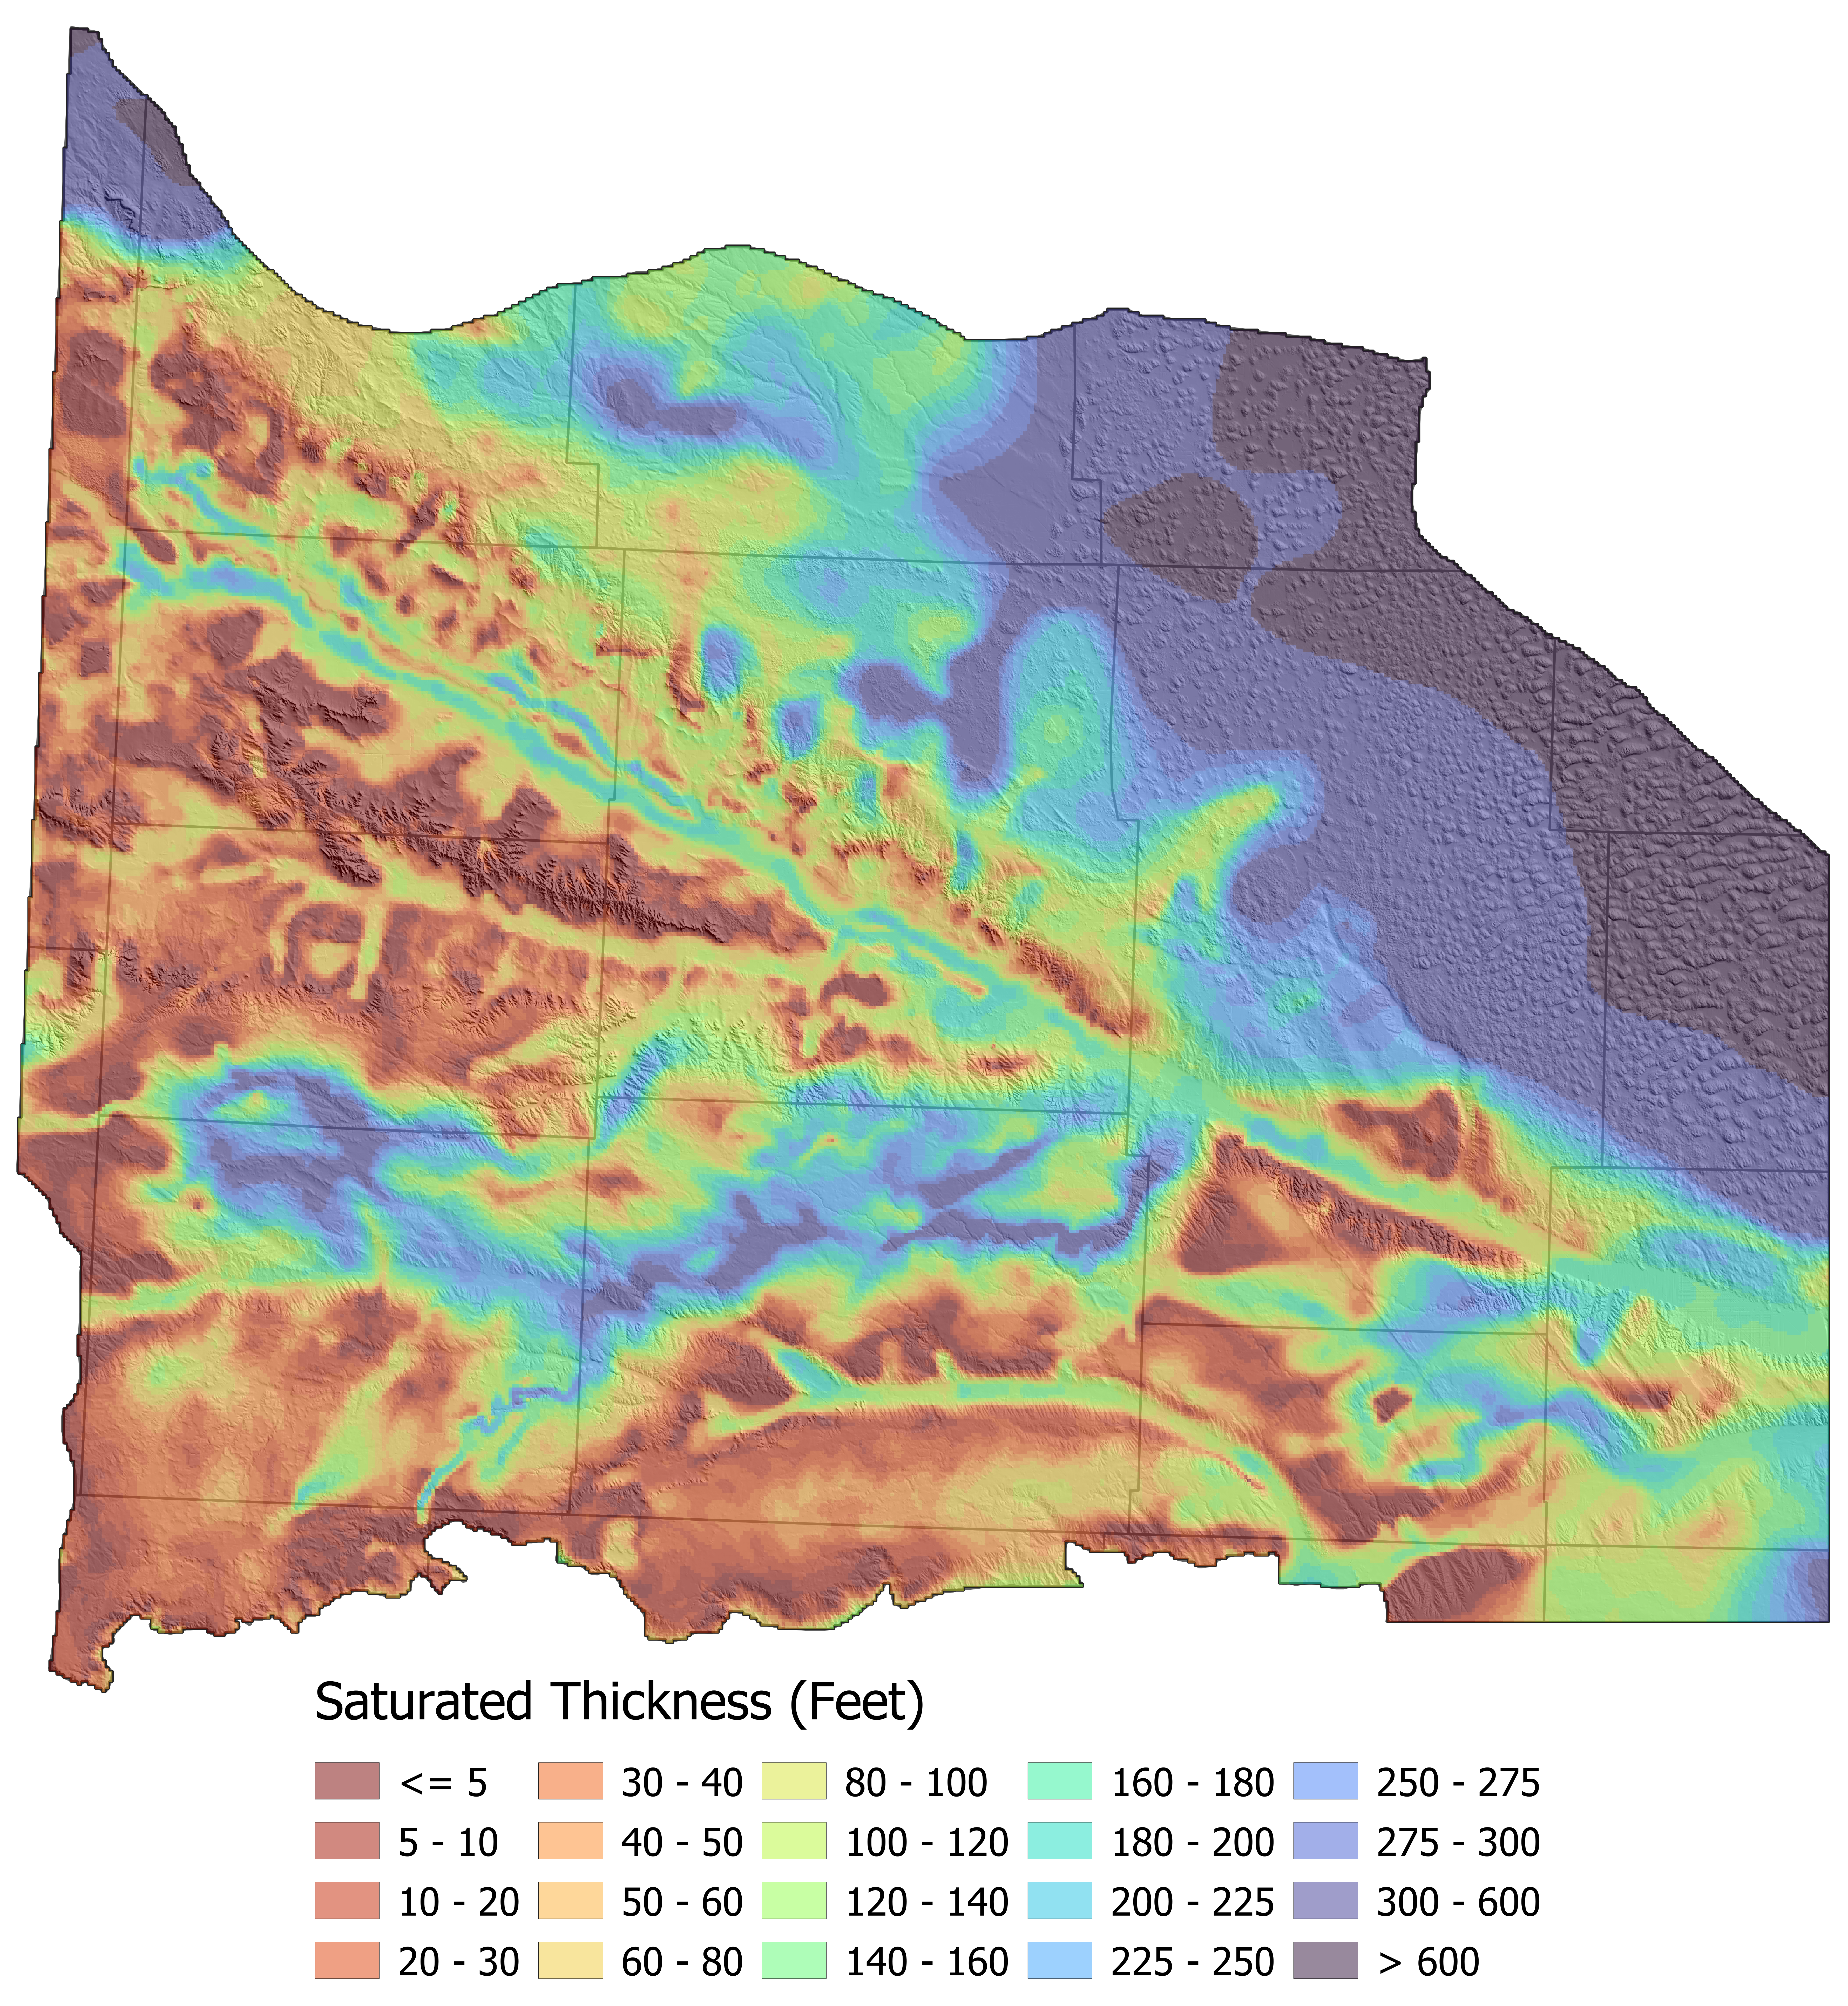
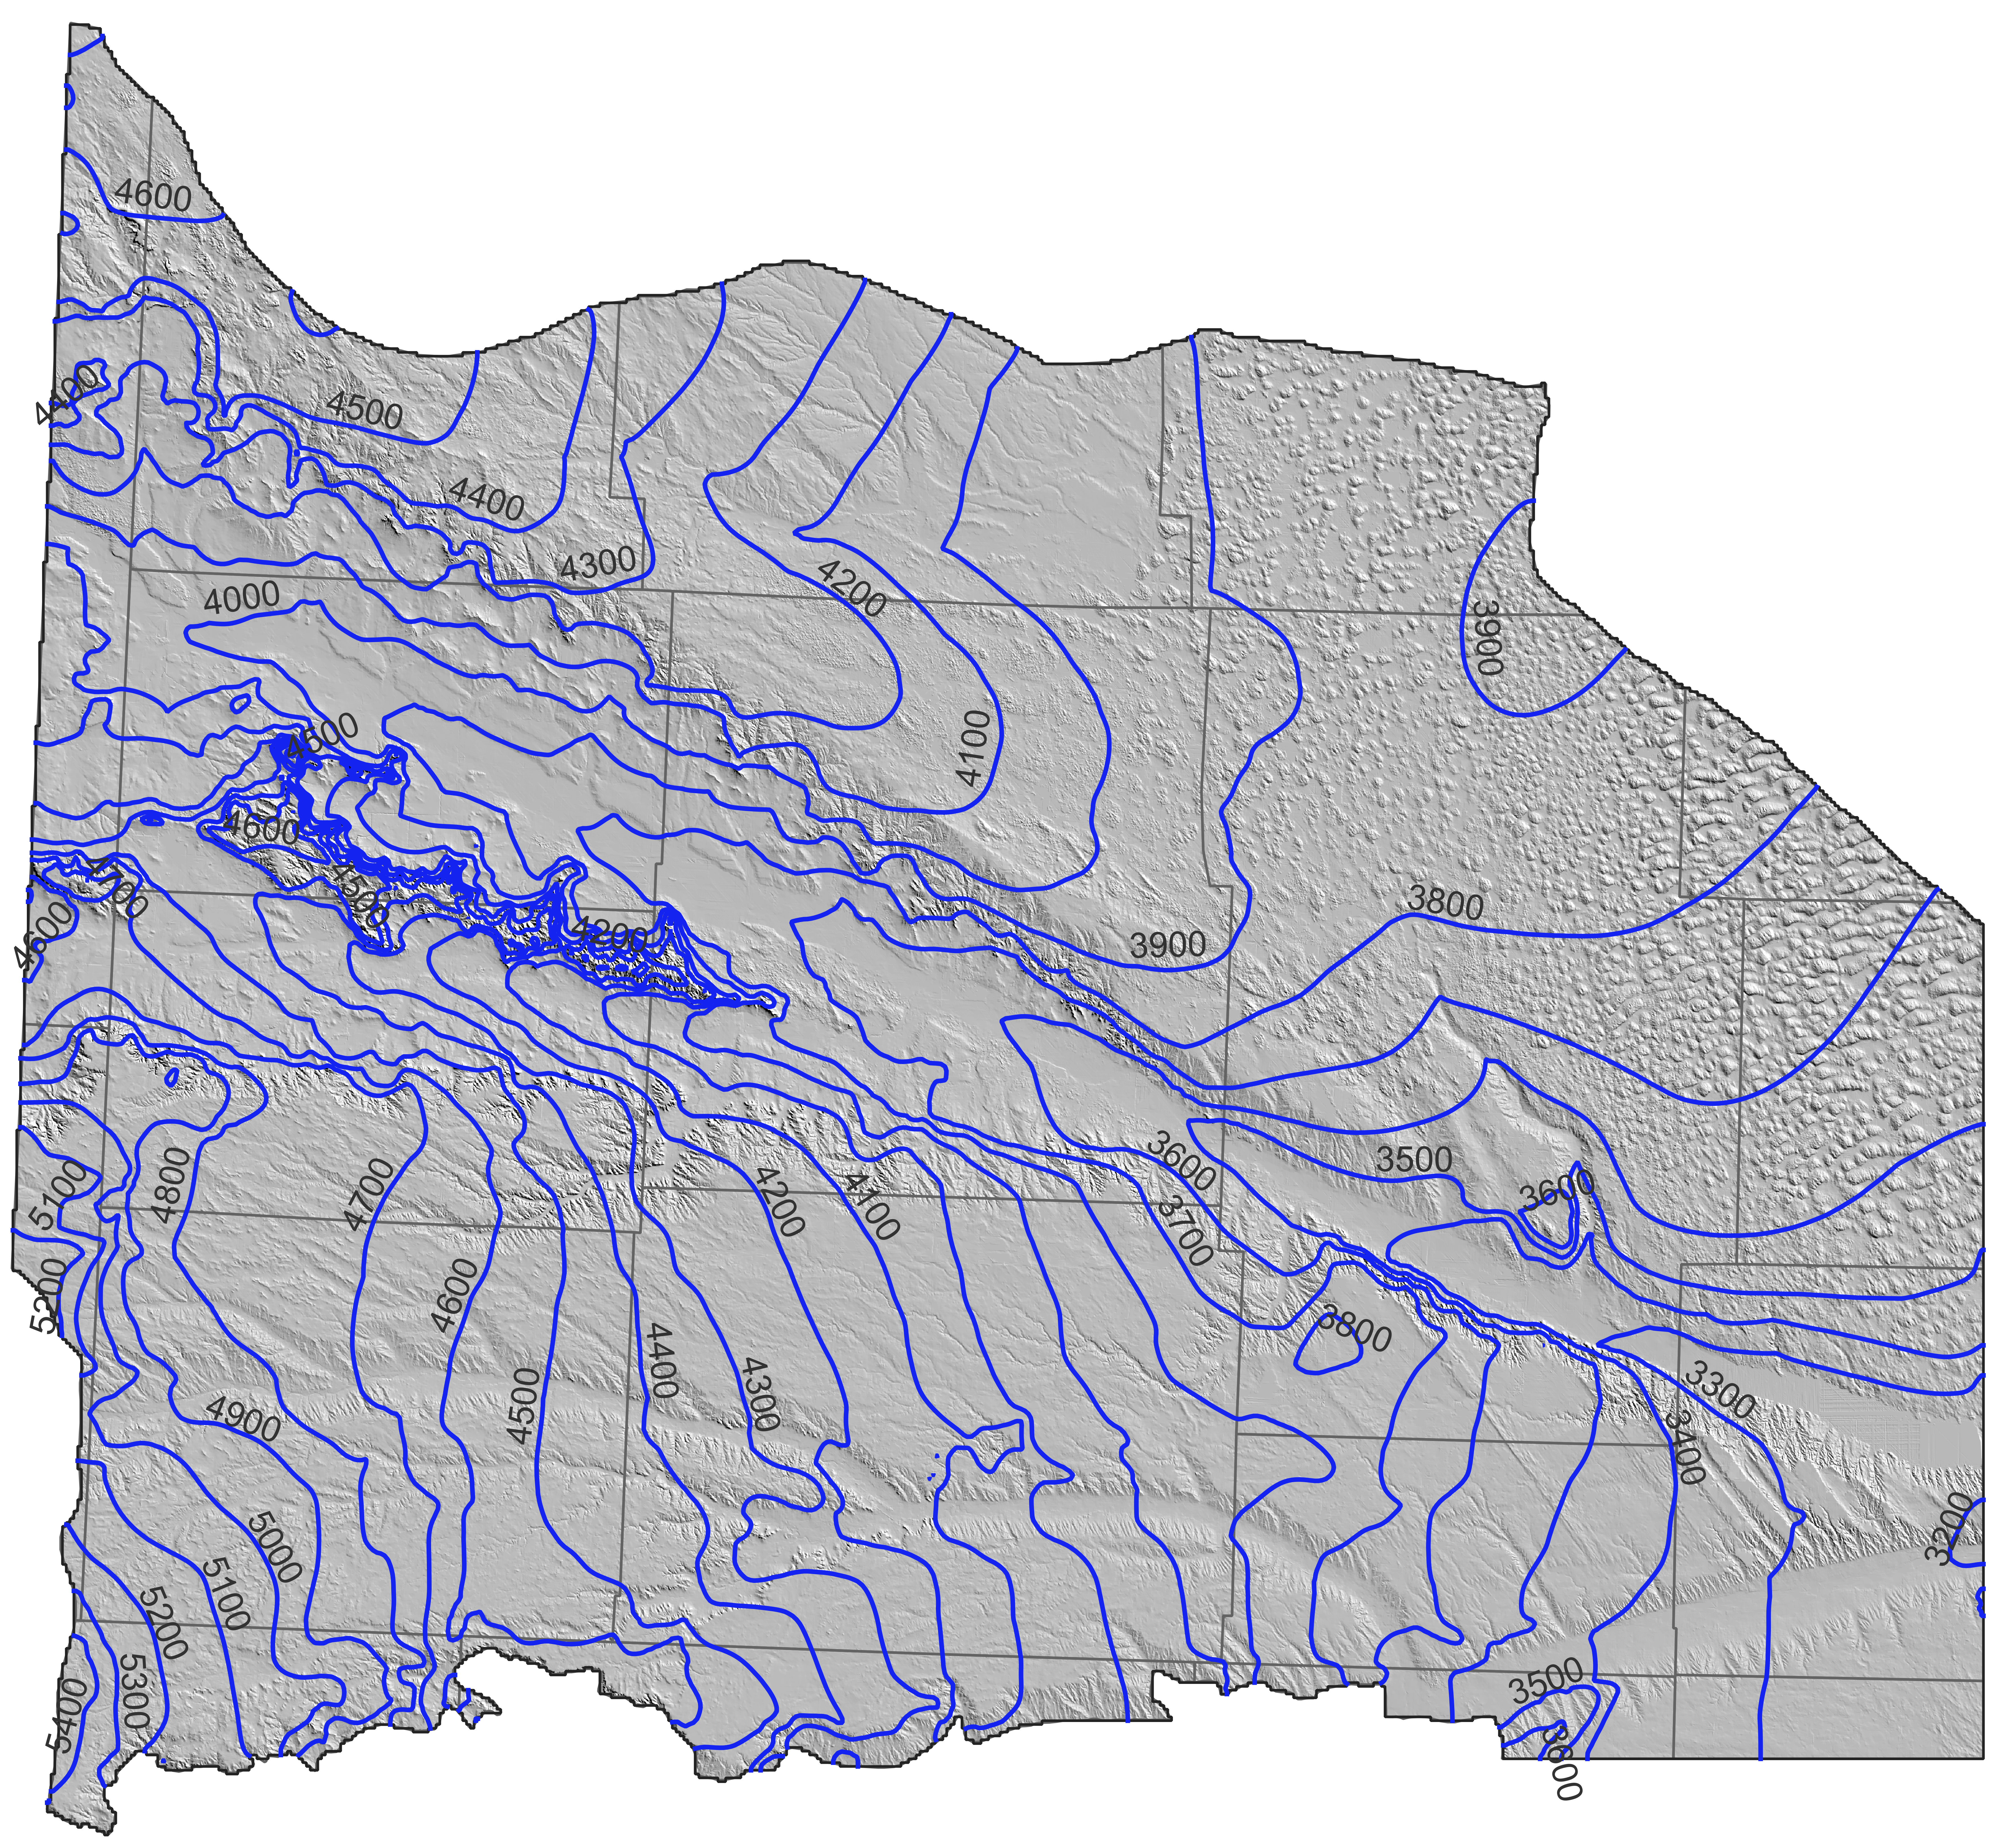
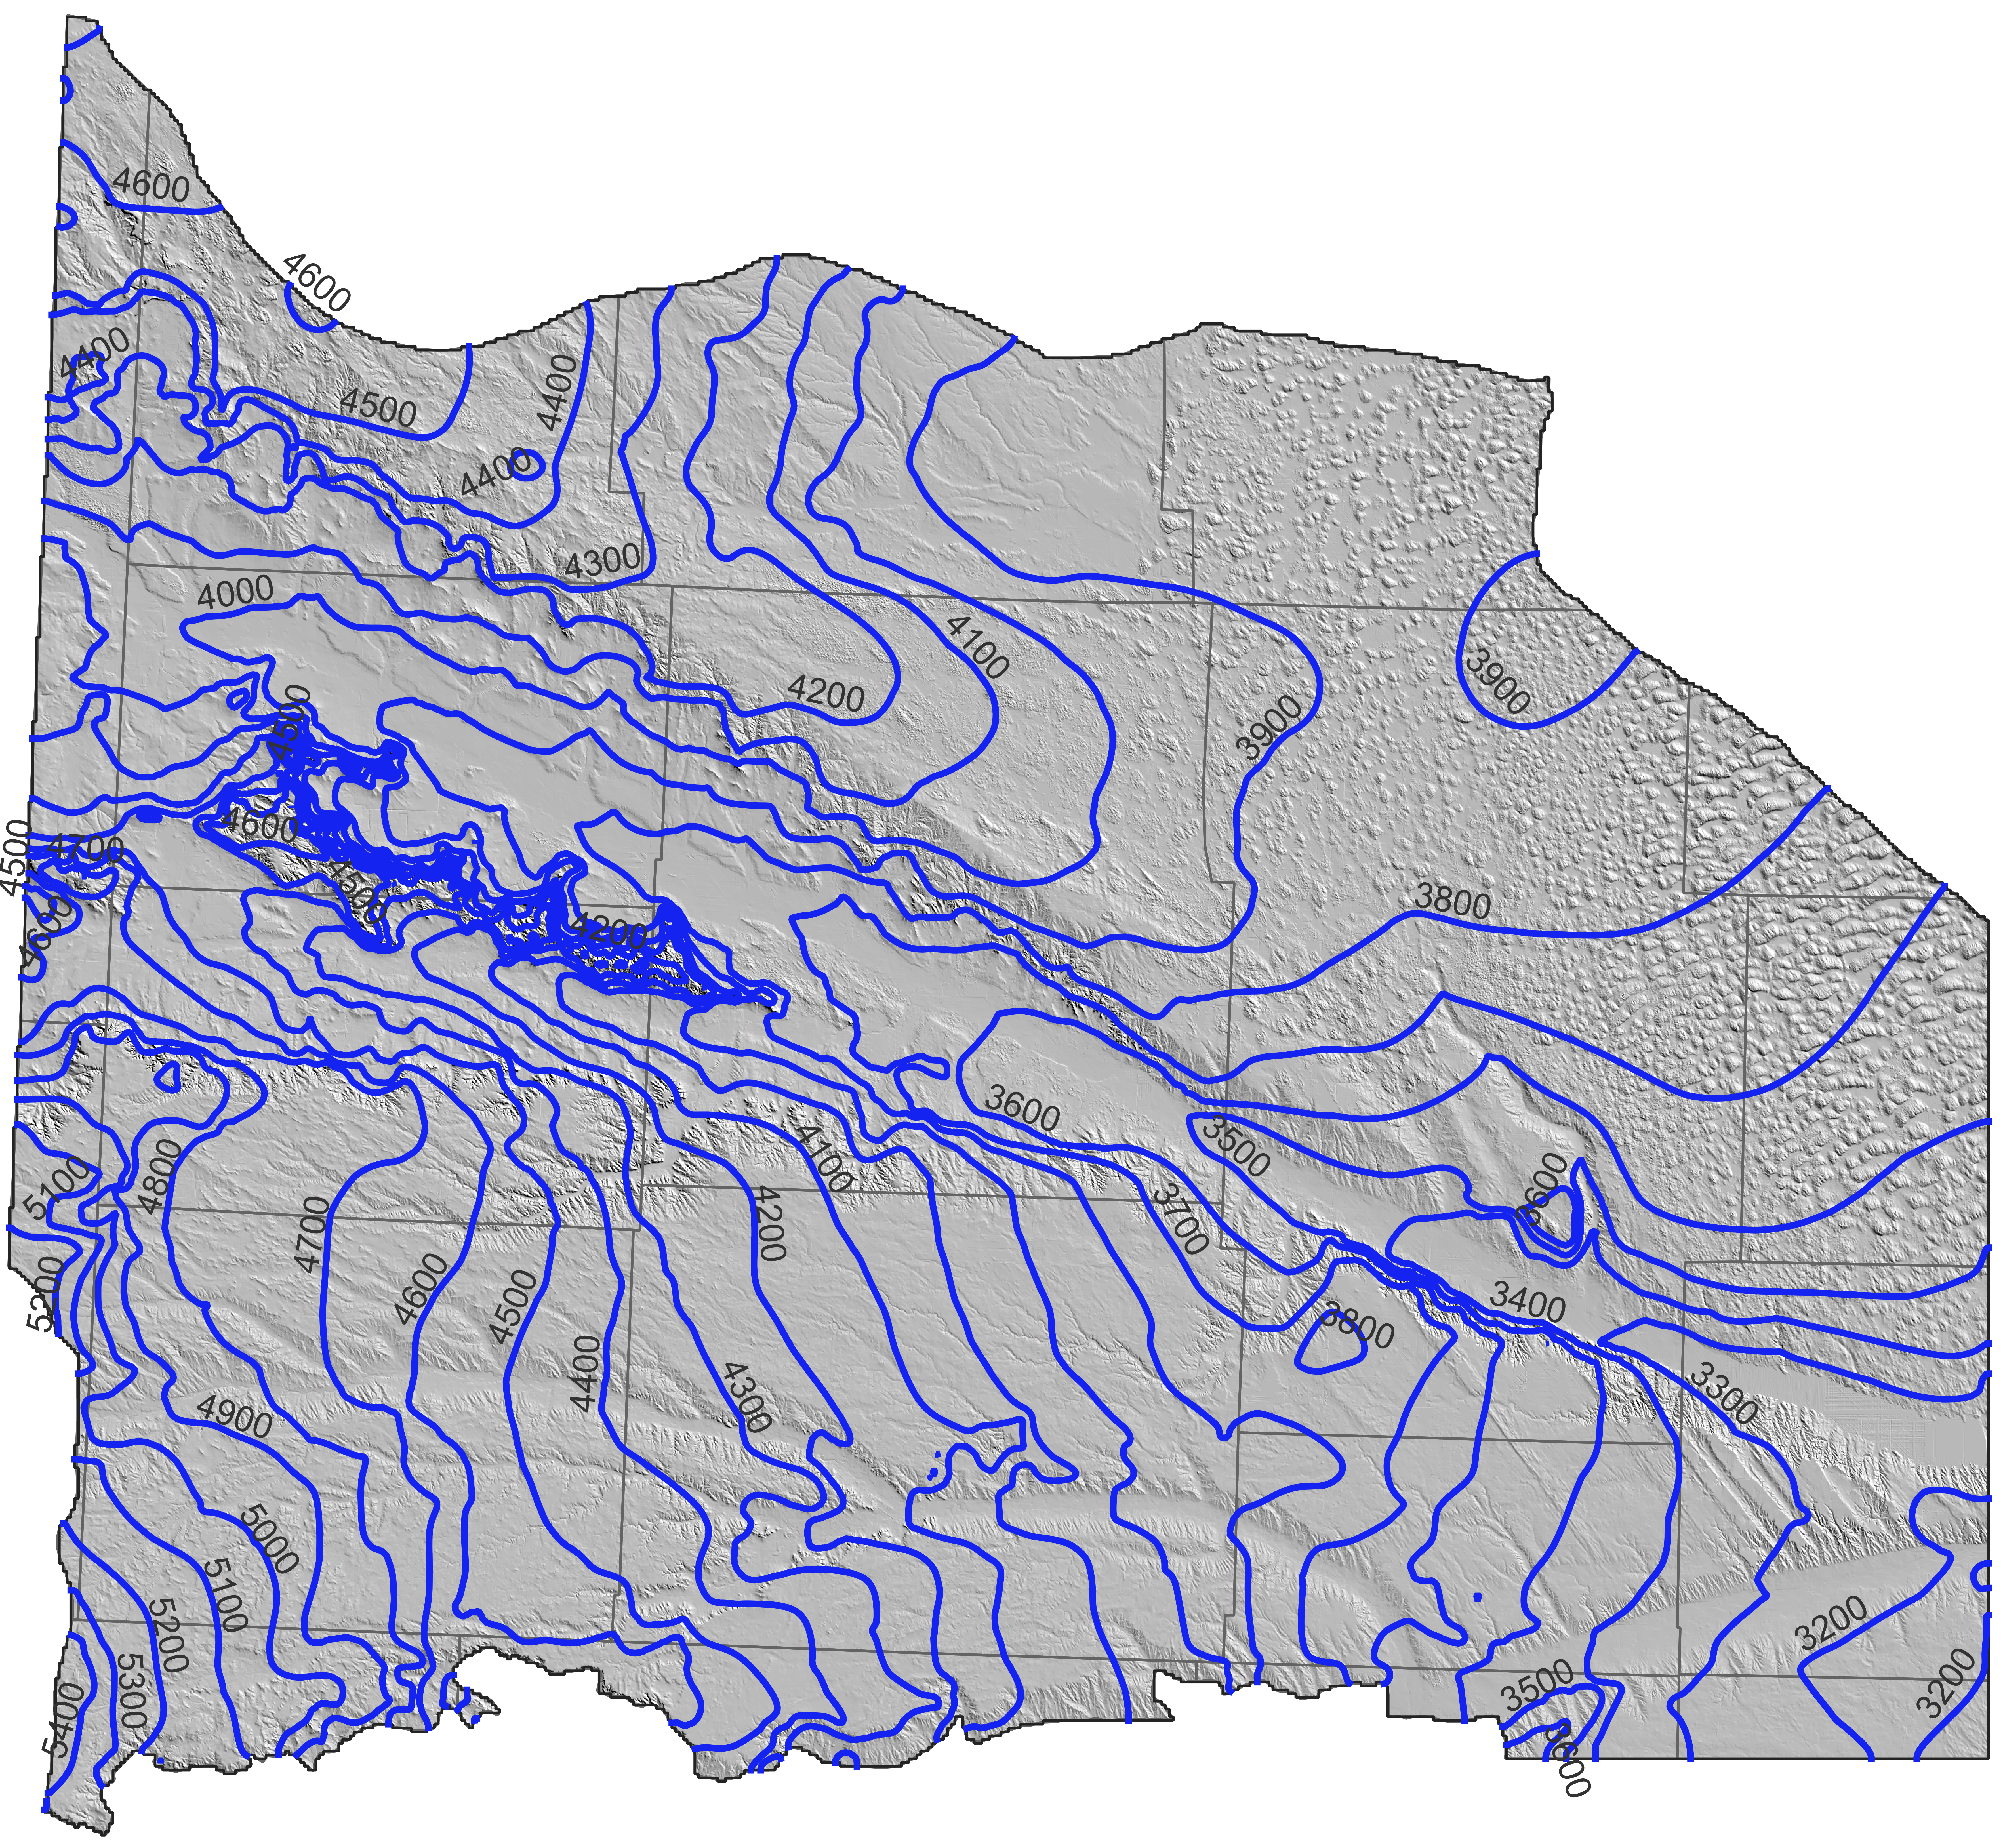
When you run the current model and analyze the results, you get beautiful, informative maps and information that tell the story of our ground water:
These visualizations are powerful tools that help NPNRD and SPNRD balance today’s agricultural needs with long-term sustainability.
Drawdown Since 1953
Saturated Thickness
The WWUMM system actually runs two linked simulations that together provide the full picture:
Together, they give district staff both the big-picture historical context and the detailed, year-by-year story of how the aquifer has evolved.
The current WWUMM Ground Water Model is a true success story of collaboration and forward-thinking water stewardship. It equips the North Platte and South Platte Natural Resources Districts with the high-quality science they need to test “what-if” scenarios, manage surface water and ground water together, support robust policies, and provide the best scientifically available information to stakeholders about aquifer health.
With these state-of-the-art upgrades, the model is ready to support decades of wise water management across the Panhandle.
The strong foundation of the current model opens the door to even more exciting future enhancements—addition of water quality modeling, better base of aquifer interpretations, and inclusion of prairie potholes and man-made terraces.
The WWUMM Ground Water Model isn’t just software—it’s a living representation of the water beneath our feet. It helps us celebrate the incredible natural system that supports our way of life while giving the districts the knowledge they need to protect it for generations to come.
Ready to learn more? Explore the maps and results, download the documentation and model files, or reach out to your local Natural Resources District office or Thad Kuntz P.G. at Adaptive Resources, Inc. Our mission is helping people in our areea understand the ground water we use!