Analyzing Western Nebraska's Water Future
How scientists mapped every irrigated and dryland acre, pivot, and crop across the Nebraska Panhandle to understand our most precious resource: water.
With over seven decades of data created, the WWUMM has been building one of the most detailed long-term records of agricultural land use in the United States. This isn't just data collection β it's a scientific detective story that reveals how our relationship with water has evolved across the southern Nebraska Panhandle.
This story builds upon a remarkable foundation of previous land use mapping efforts across the North Platte and South Platte Natural Resource Districts. The most recent dataset represents a continuation of long-term efforts to document how agricultural land use has evolved across the southern Nebraska Panhandle, creating one of the most detailed long-term land use records in Nebraska.
The heart of this work is aerial imagery. Scientists used a wide range of sources spanning many years β from black-and-white photographs taken in 1953 to high-resolution color infrared NAIP imagery from 2003βCurrent. Each set of images reveals how the agricultural landscape evolved over time.
Click the arrows to see how the landscape evolved from 2004 to 2024
The Natural Resource Districts maintain detailed records of every "certified acre" β each parcel of land with legal rights to irrigate using ground water. These aren't just lines on a map. Each one has a unique ID, tracks which wells supply it, what crops grow there, and whether it's served by ground water only or is commingled.
This is where the real detective work begins.
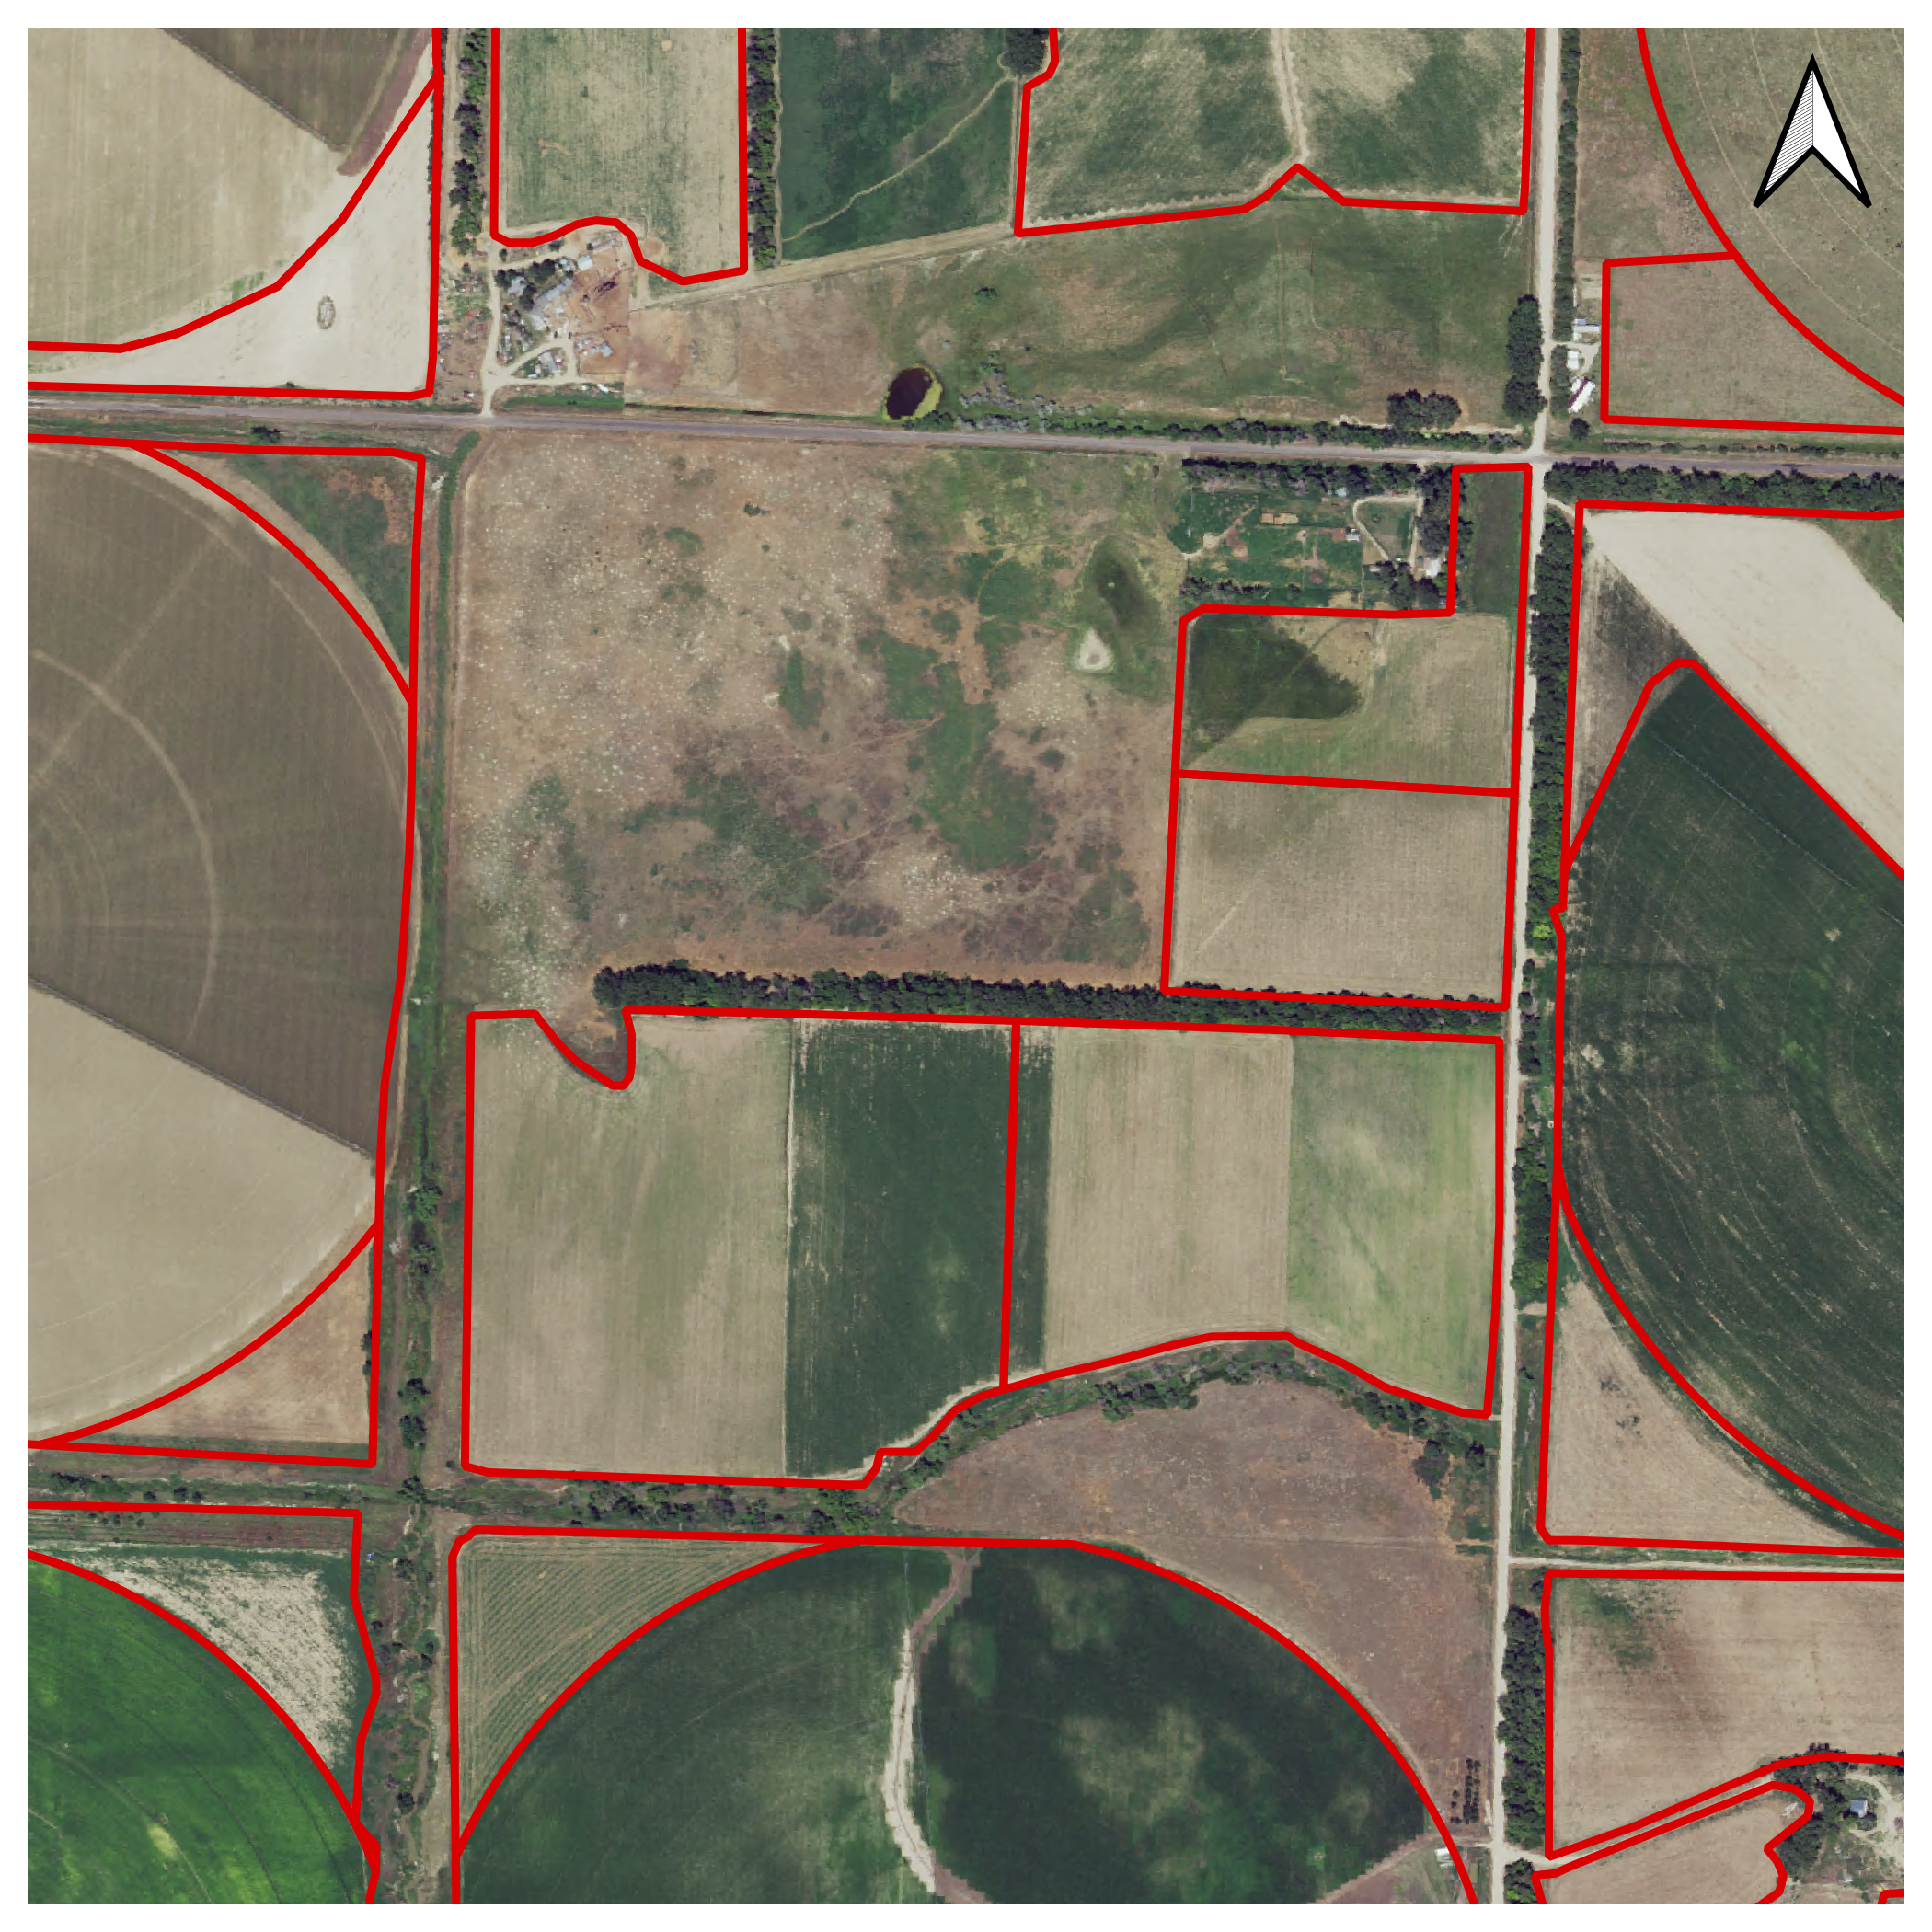
Flood Irrigation (2016)
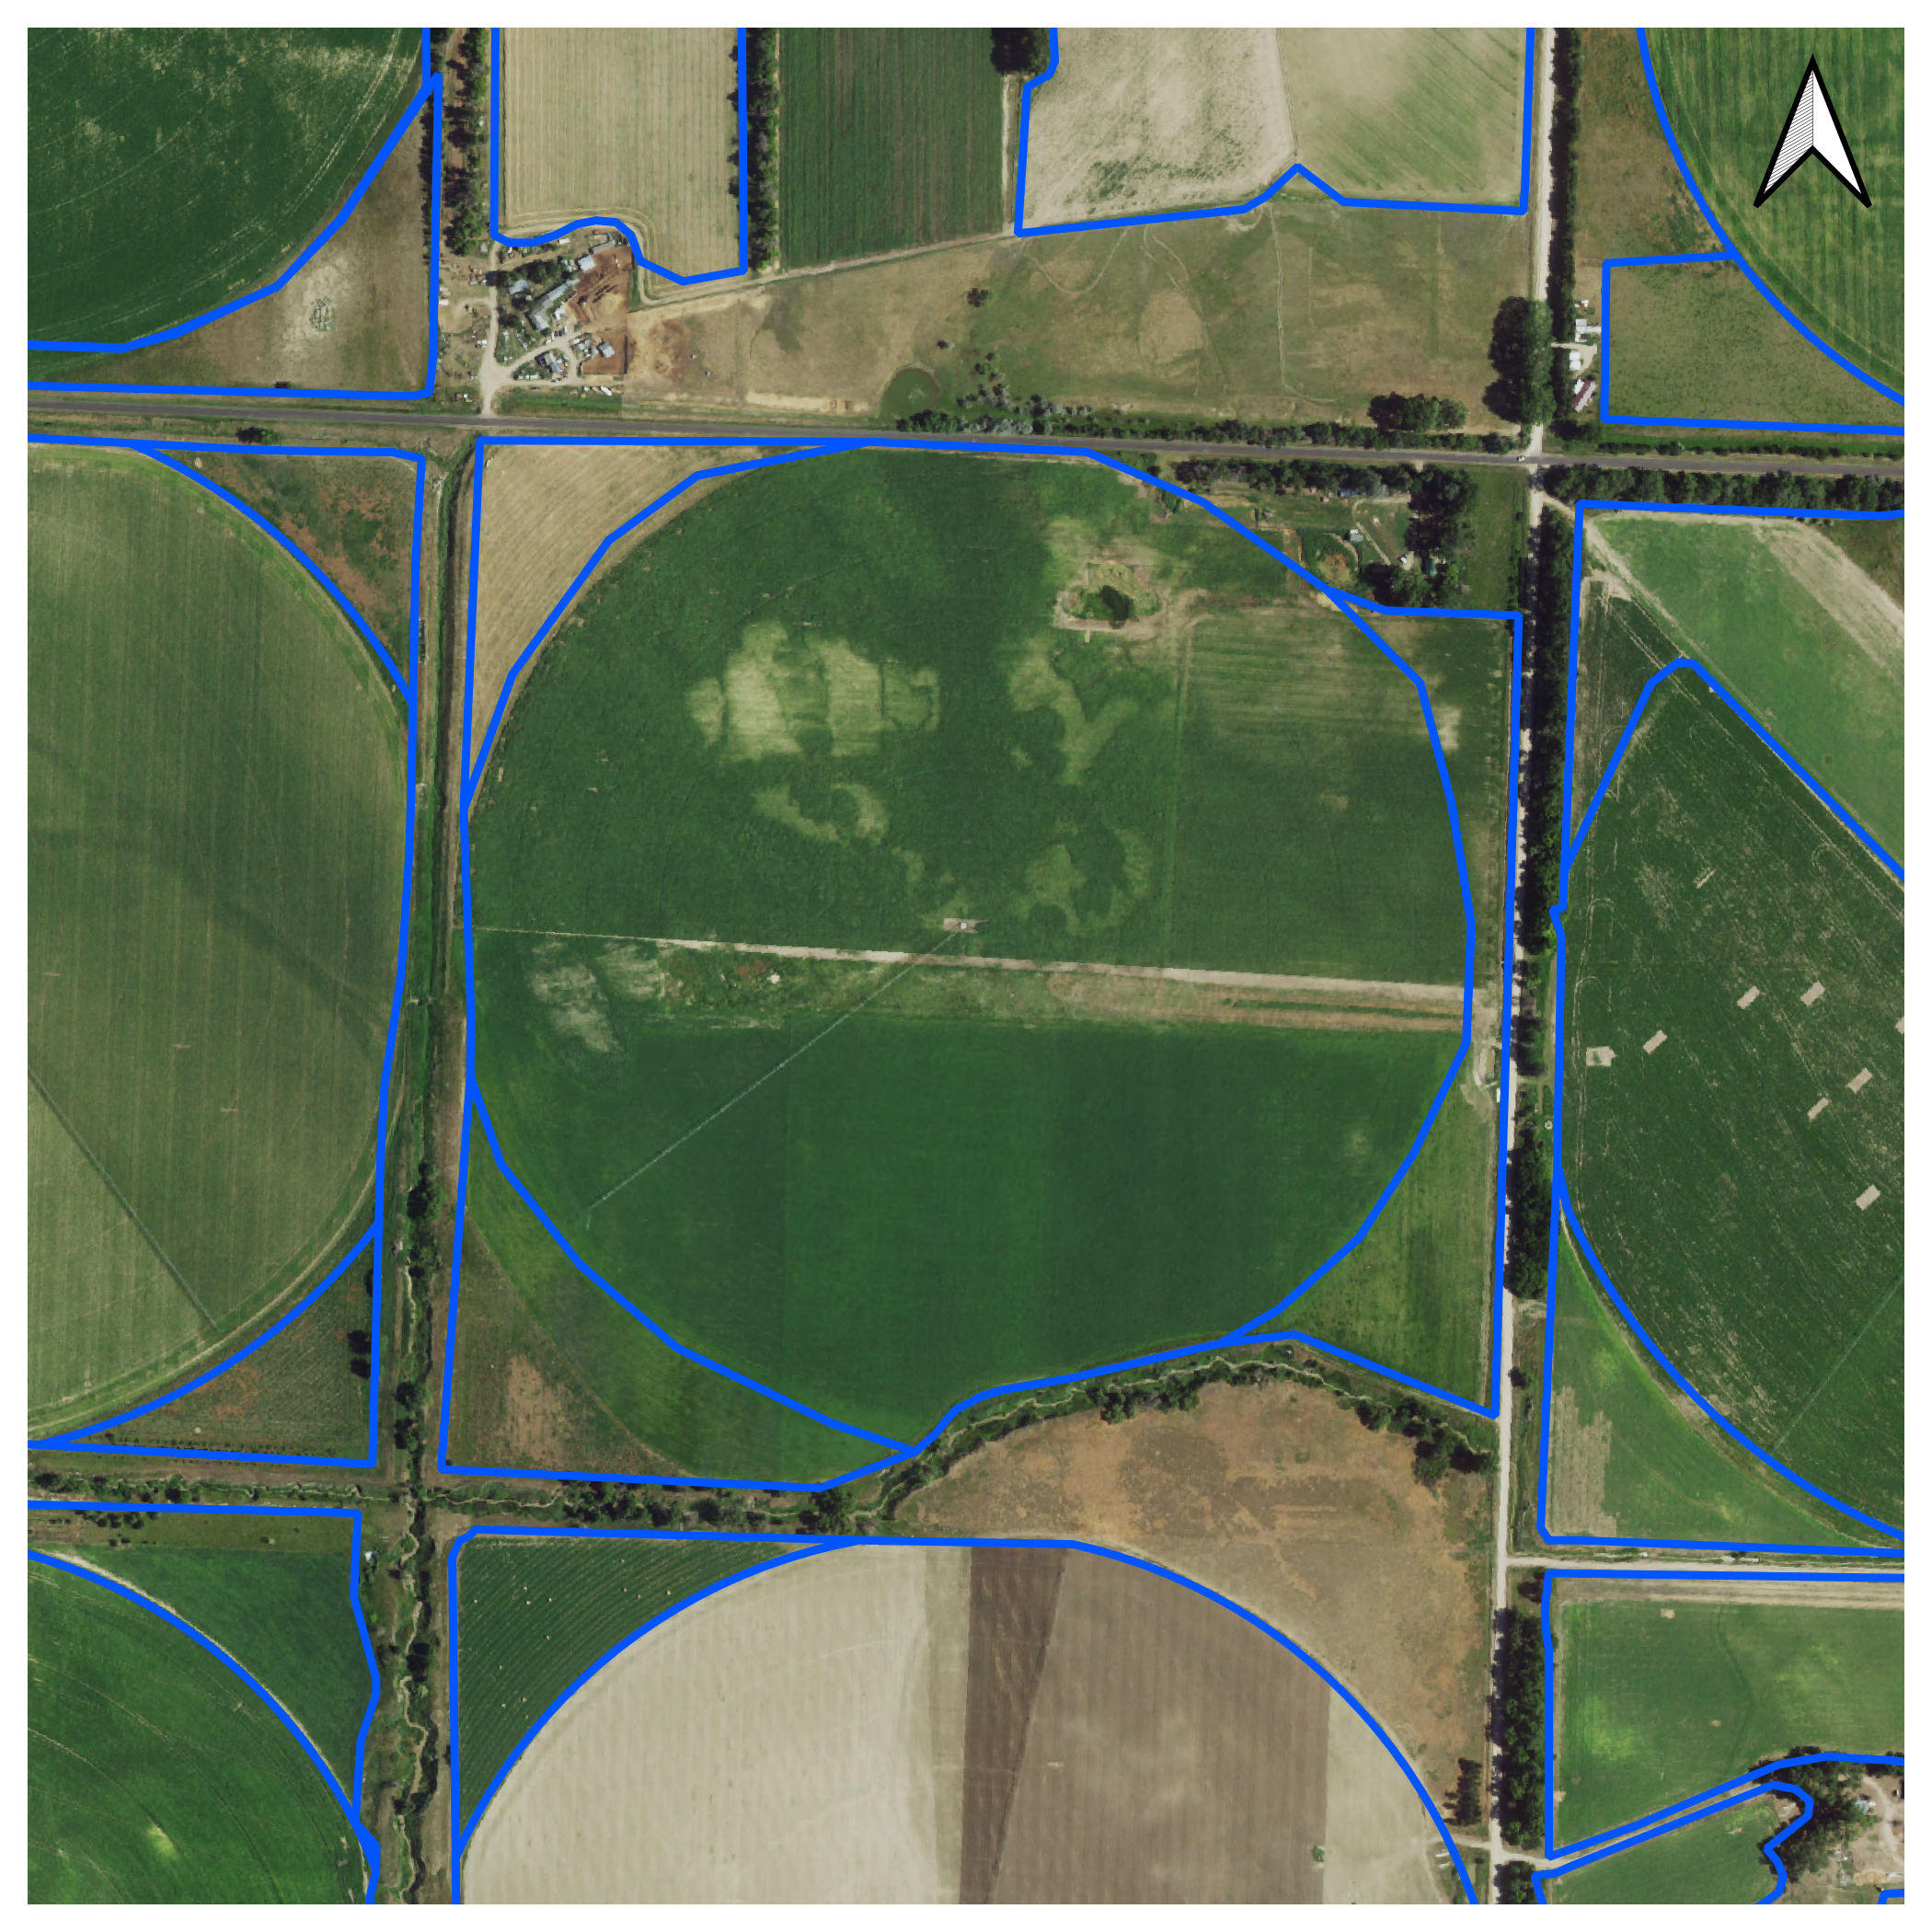
Center Pivot Sprinklers (2018)
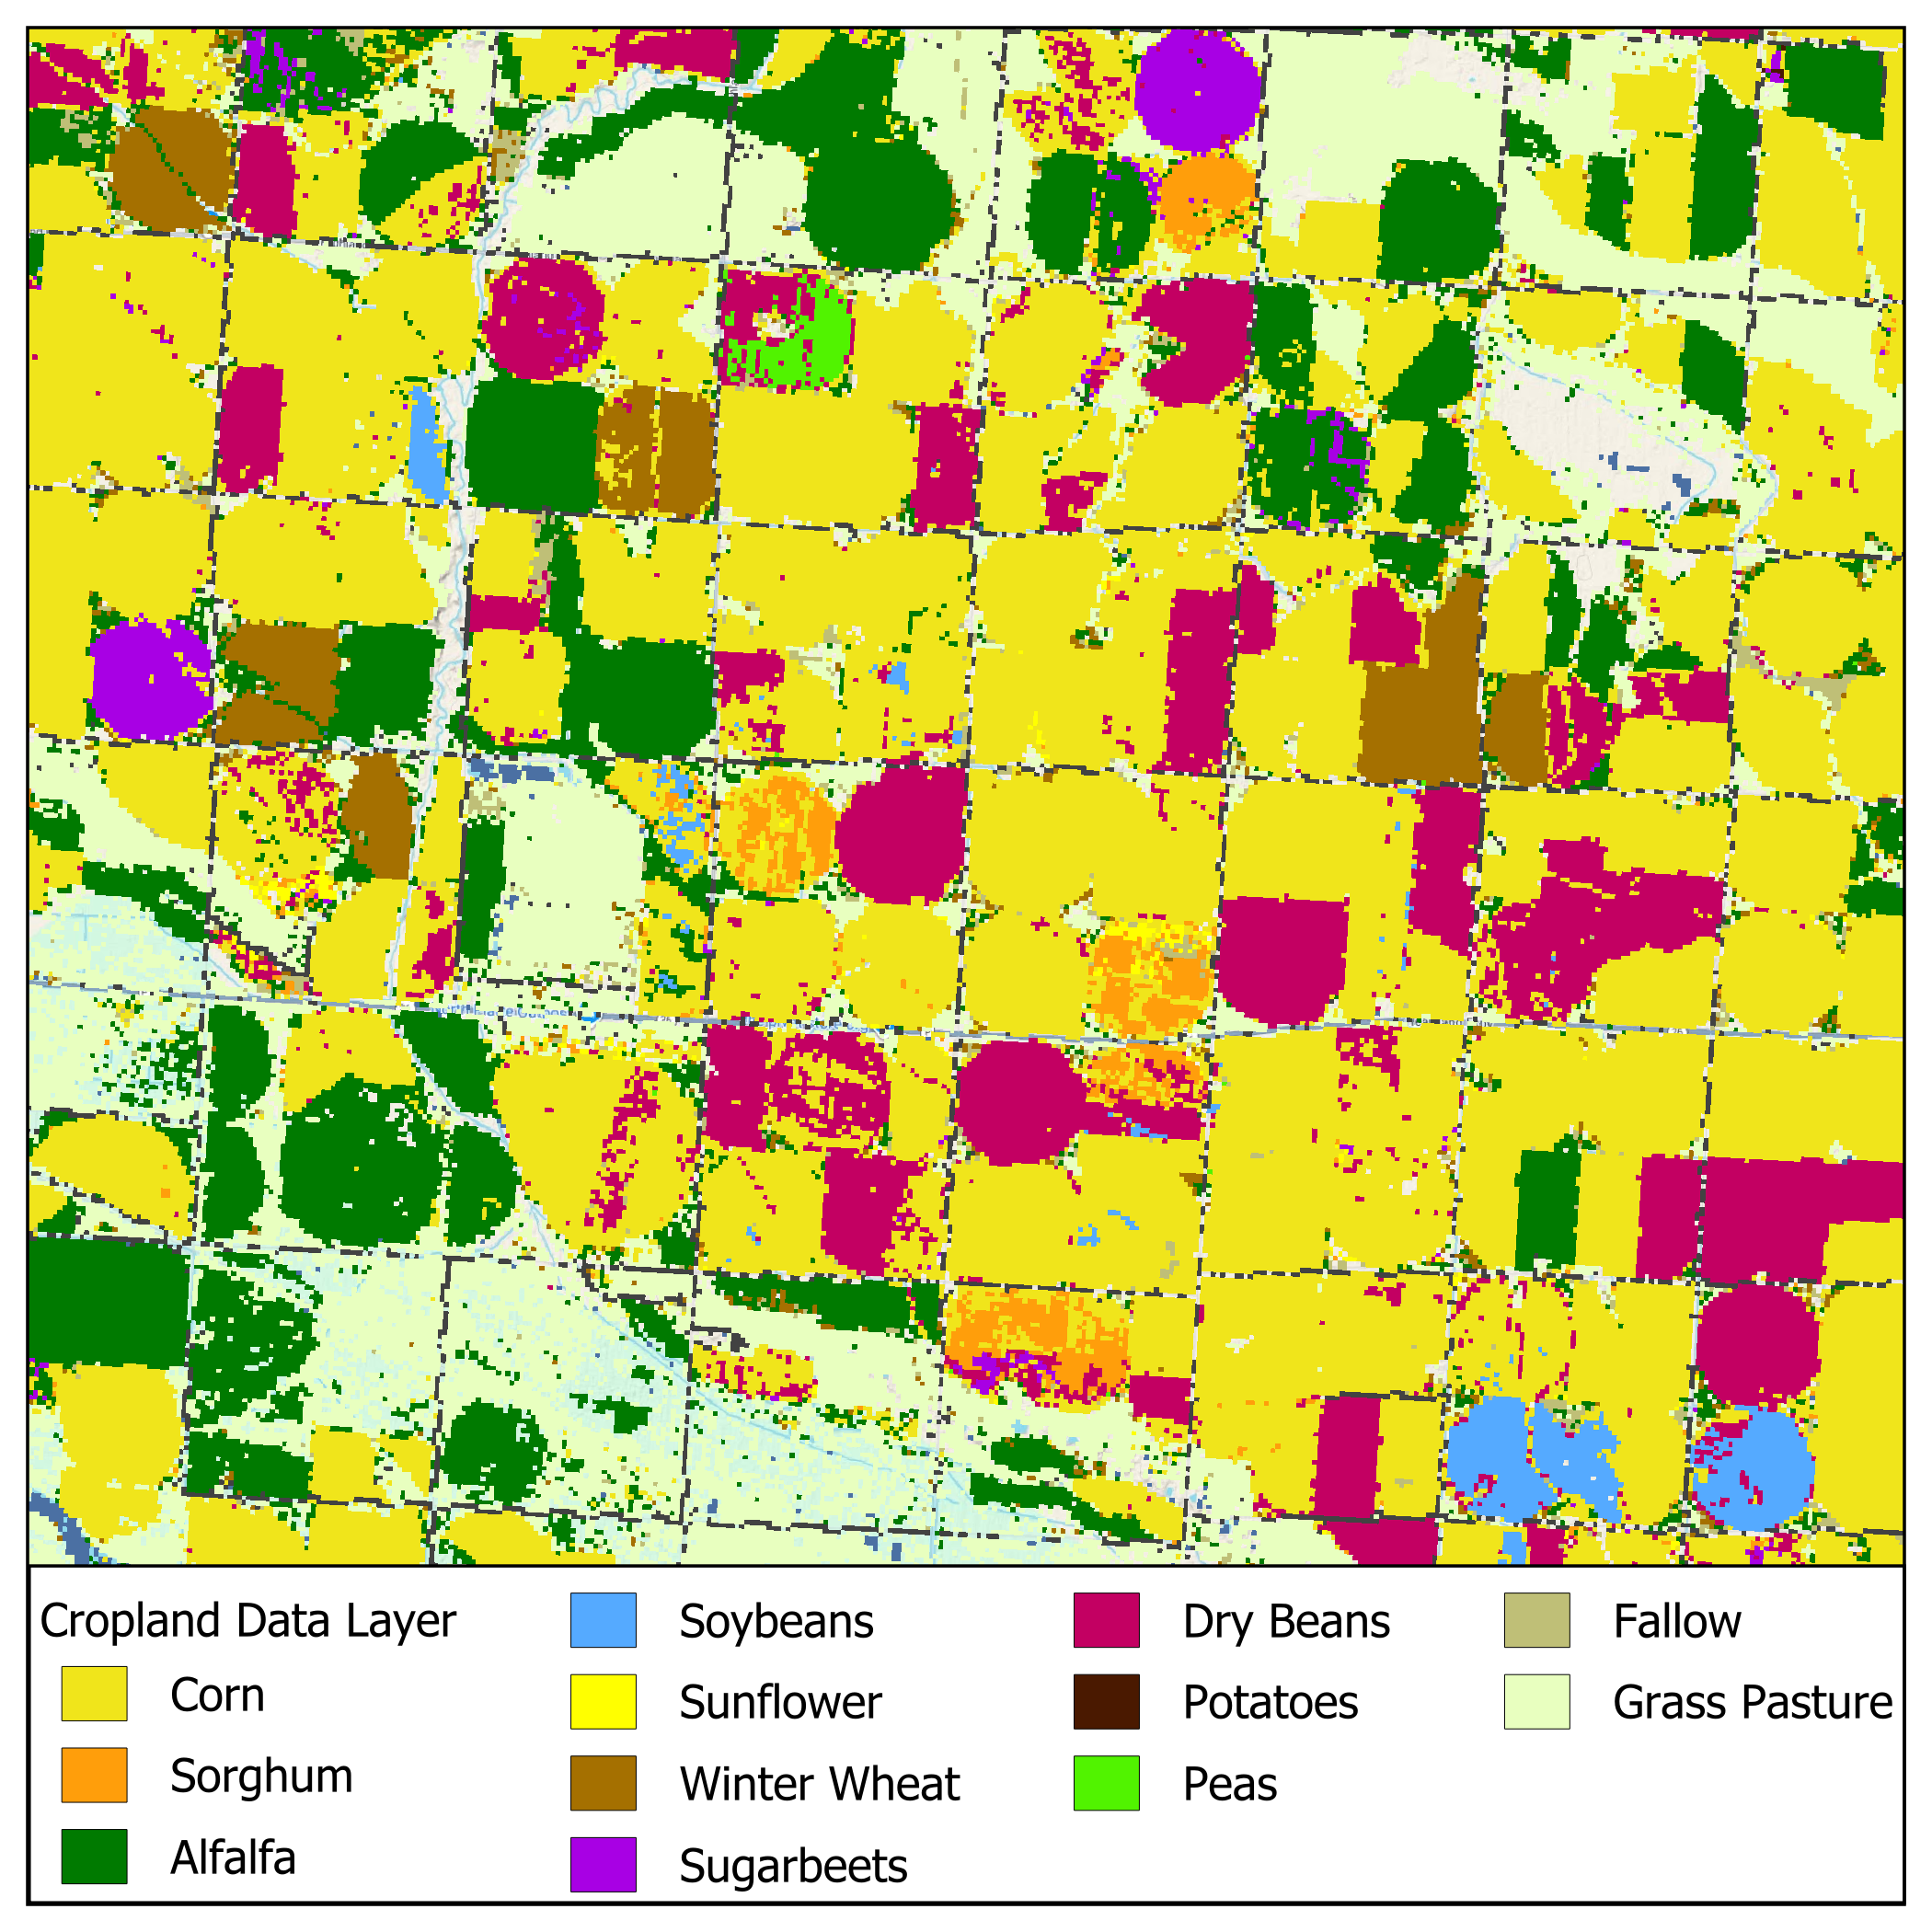
To determine crops within the WWUMM area our scientists used NRD collected information for ground water irrigated parcels and established products such as the United States Department of Agriculture's Cropland Data Layer for parcels not tracked by the NRDs. A typical field has up to four different crops. Crops include corn, dry beans, alfalfa, wheat, and more.
Cropland Data Layer crop classification in the North Platte NRD valley area.
Looking for circular patterns versus straight borders tells us whether farmers use center pivot sprinklers or traditional flood irrigation. This dramatically affects water use efficiency.
Each field gets 20+ attributes: which wells supply it, associated surface water structure, county, crop coverage percentages, when it first started being irrigated, and more.
The final product is an incredibly detailed spatial dataset covering the entire North Platte and South Platte NRDs. It includes:
This isn't just a map of crops. It's a foundational dataset that powers the entire WWUMM. Every evapotranspiration calculation, every recharge estimate, every ground water model run depends on knowing exactly what's growing where and how much water it's using.
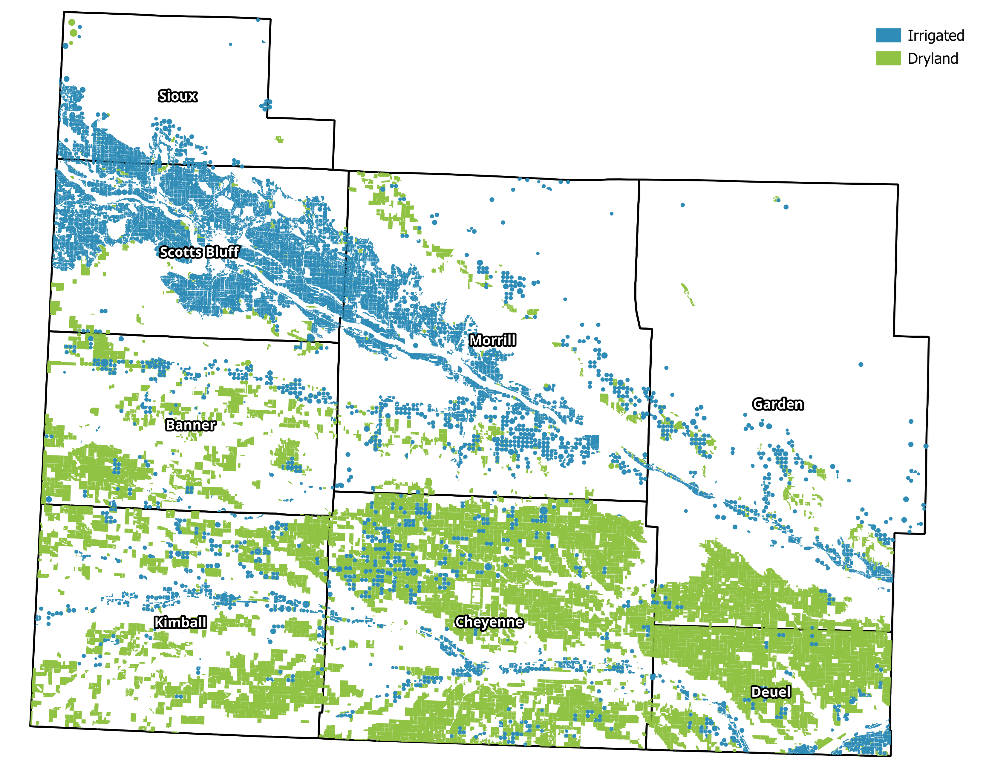
This map shows the spatial distribution of irrigated (blue) and dryland (green) agriculture across the North Platte and South Platte Natural Resource Districts. Each dot represents a location sampled from decades of aerial imagery.
Blue = Irrigated | Green = Dryland/Non-irrigated. Data synthesized from historical NAIP and other datasets.
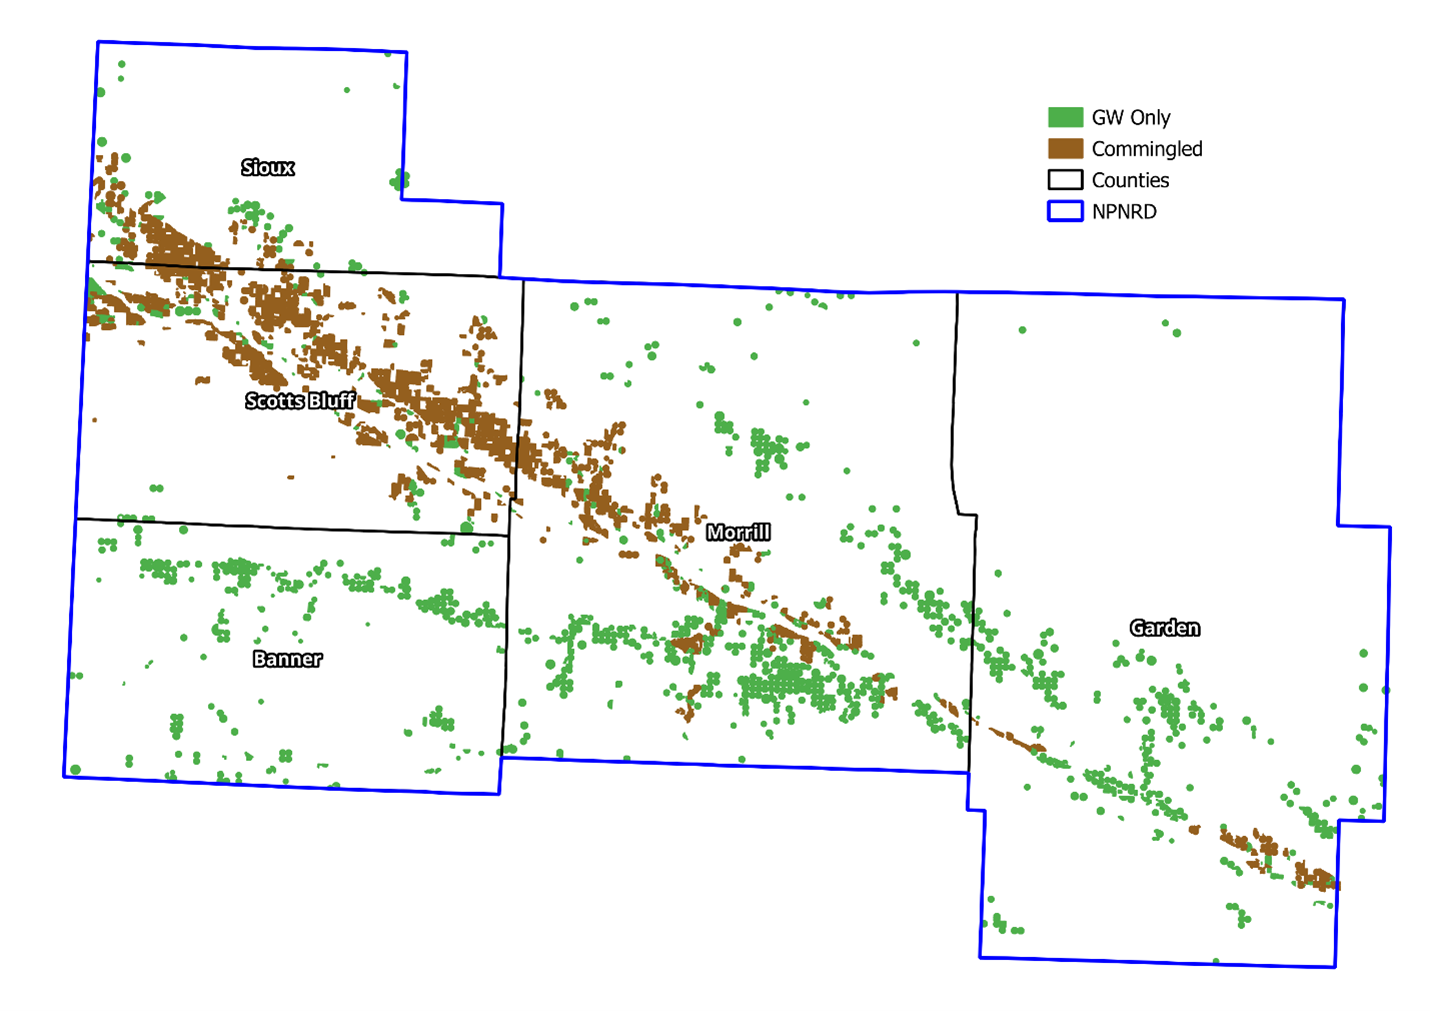
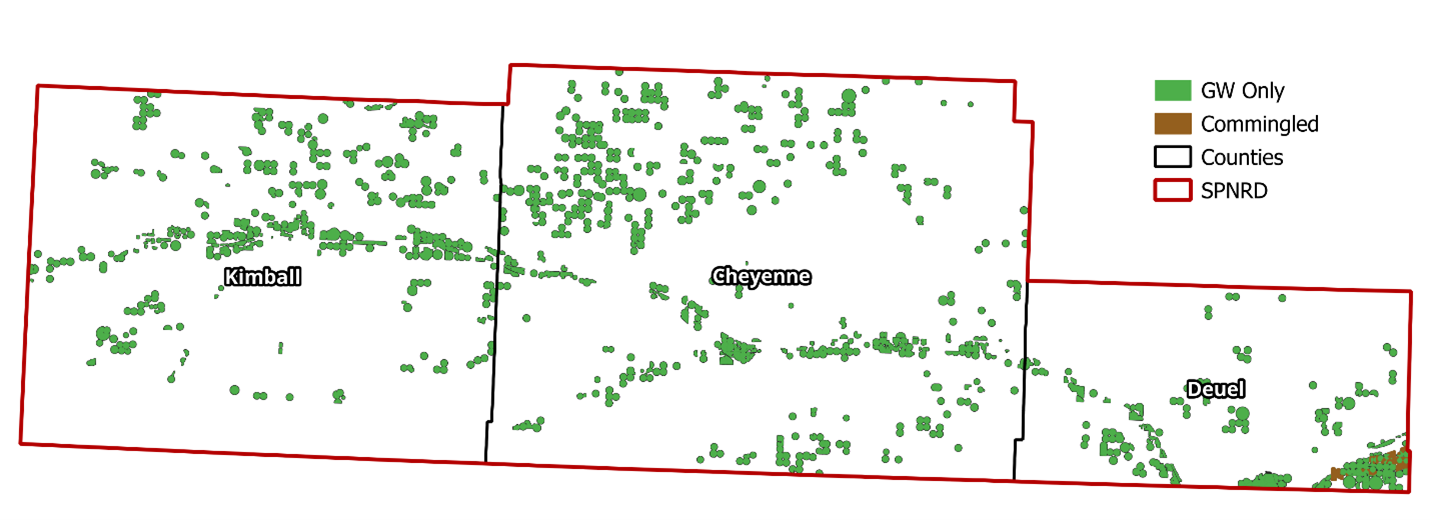
These maps show the spatial distribution of certified irrigated acreage in each Natural Resource District, broken down by water source (Ground Water Only and Commingled).
Certified irrigated acreage (Ground Water Only and Commingled)
Filter by Natural Resource District and dataset to explore how land use, water sources, irrigation methods, dryland crops, and irrigated crops have changed since 1953.
Year-by-year breakdown of irrigated acreage by water source (Surface Water, Ground Water, Commingled), totals, changes, and certifications.
This land use dataset is one piece of a much larger modeling effort.
β Return to the Full WWUMM Story