From 2017 through 2020, a powerhouse team from Adaptive Resources, Inc. and the University of Nebraska–Lincoln Conservation and Survey Division teamed up for an exciting mission: to dramatically improve our understanding of the High Plains Aquifer across the southern Nebraska Panhandle. This collaborative project, called the Hydrogeology of Western Nebraska, was funded by the Nebraska Environmental Trust and the South Platte, North Platte, and Twin Platte Natural Resources Districts. It was built specifically to give the Western Water Use Management Modeling (WWUMM) effort the most accurate foundation possible.
What the Study Delivered
The team scanned, digitized, and carefully interpreted an astonishing 15,421 oil and gas geophysical well logs from 13 counties. They combined these with data from water well driller logs, monitor well logs from the Conservation and Survey Division, and the U.S. Geological Survey airborne electromagnetic (AEM) surveys. Using specialized software, geologists examined key signals like resistivity (how well rock conducts electricity) and the spontaneous potential curve (which reveals permeability) to pinpoint exactly where the aquifer ends and the underlying layers begin.
Mapping the Massive Dataset
To give you a sense of the enormous scale of this effort, here are three key maps from the study that show exactly what data went into the final interpretation:
ALL WELLS & LOGS EVALUATED
All Wells and Logs Evaluated
This map shows the full scope of the project — the locations of all 15,421 oil and gas geophysical logs, CSD test holes, and Natural Resources District monitor wells that the team reviewed and evaluated.
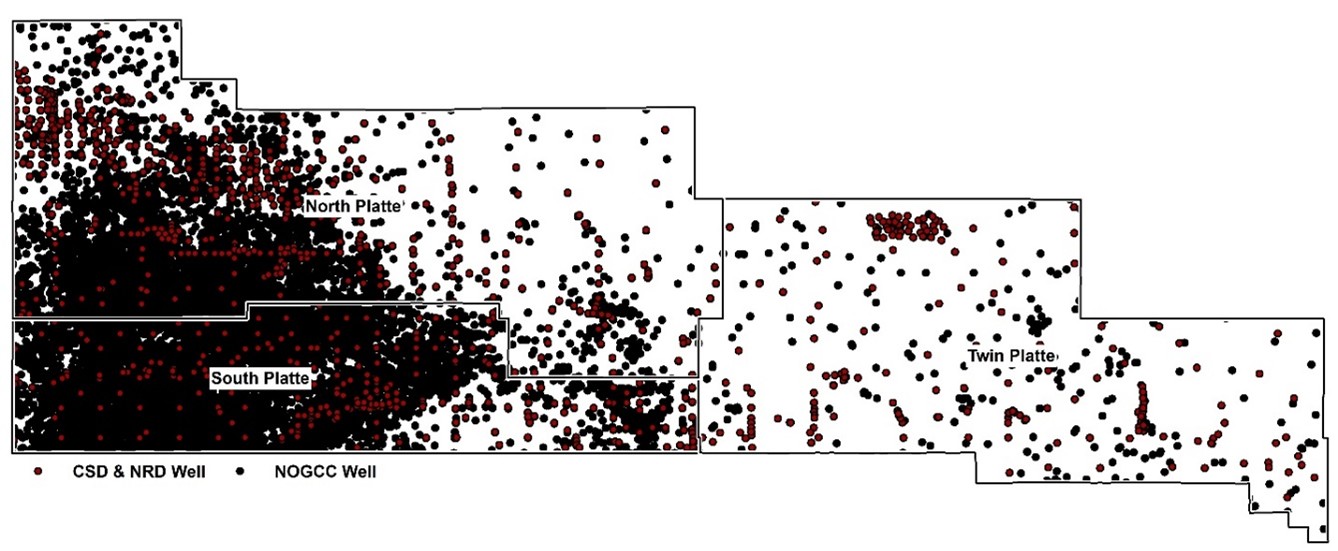
NOGCC Oil and Gas Well, CSD Test Hole, and Natural Resources District Monitor Well Locations
USABLE GEOPHYSICAL LOGS
Geophysical Logs Actually Used for Interpretation
Not every well provided usable data. Map 2 highlights the specific wells and logs where useful geophysical data existed and were ultimately used to create the final base-of-aquifer interpretation.
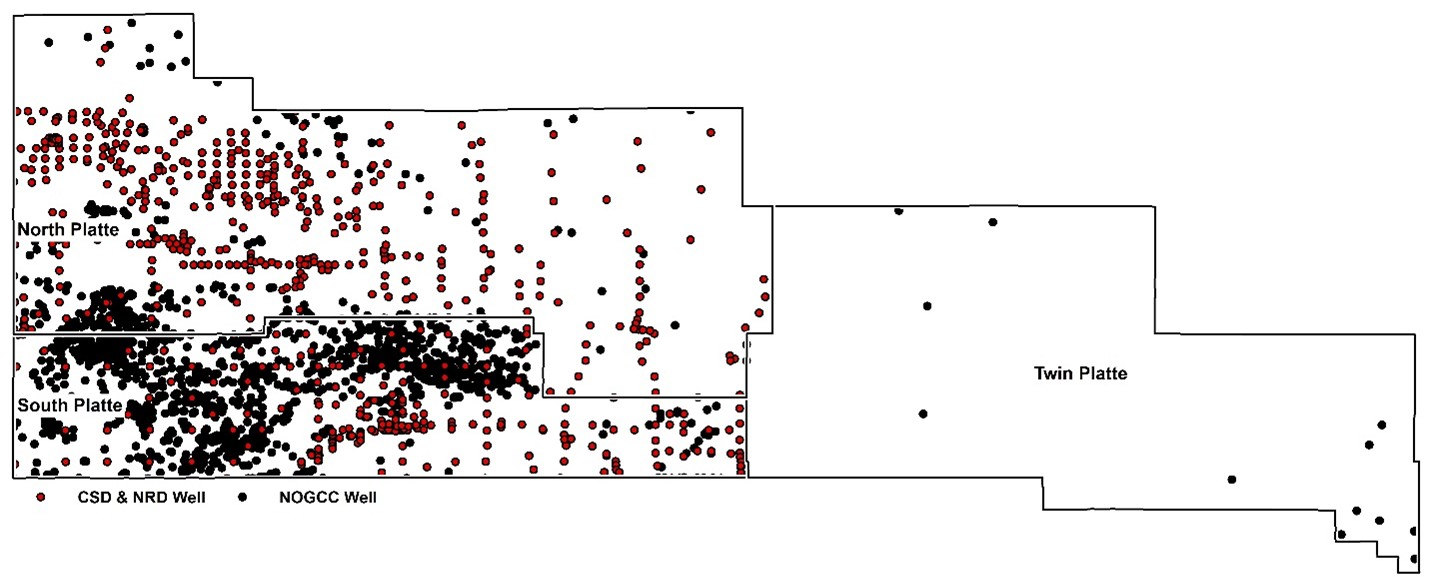
Locations of the NOGCC Oil and Gas Wells, CSD Test Holes, and Natural Resources District Monitor Well Geophysical Logs used in this study
ALL DATA SOURCES
All Data Sources Used for the Final Interpretation
This map pulls everything together — it shows all the information sources that were synthesized to create the refined base of the High Plains Aquifer surface.
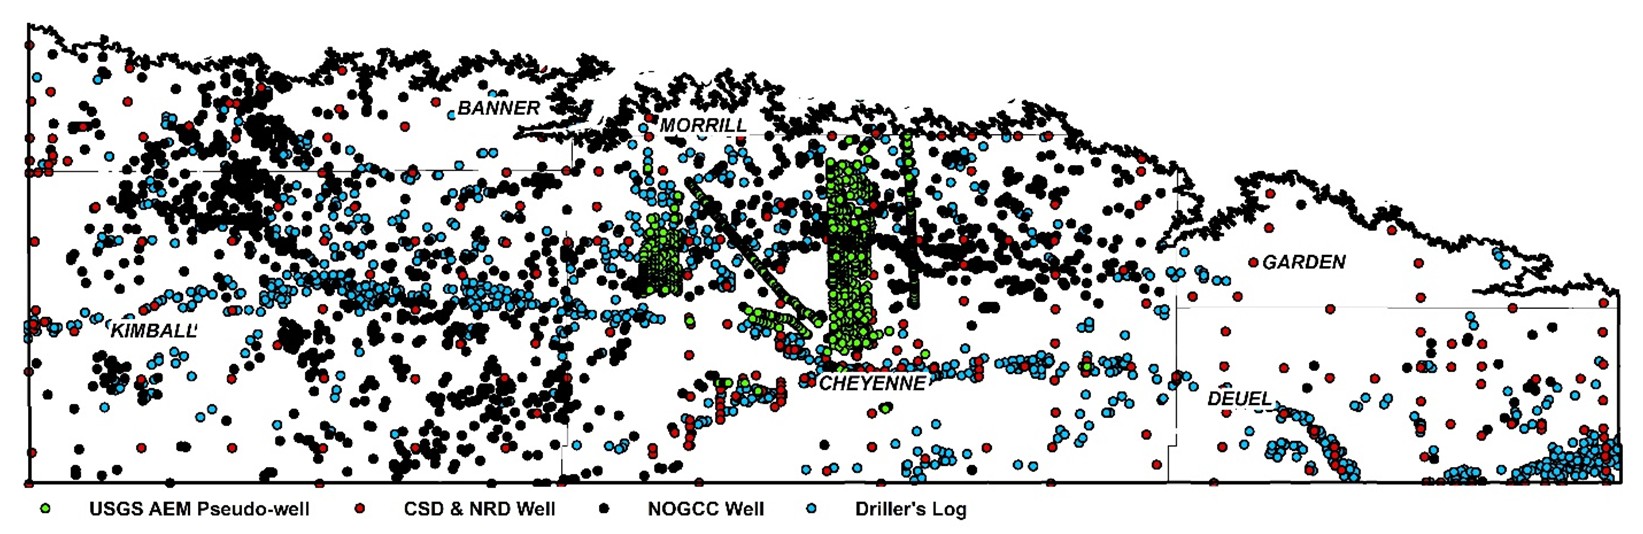
Information Used to Create the Base of the High Plains Aquifer Surface Interpretation
Every single interpretation went through multiple rounds of in-depth expert review by teams of geologists. Picks were labeled “confident” or “questionable,” and structural cross sections helped double-check everything. The result? A much clearer, more detailed picture of the aquifer’s base — especially in the complex southern part of the WWUMM area (Kimball, Cheyenne, Deuel, and southern portions of Banner, Morrill, and Garden counties).
Why Geophysical Logs Matter
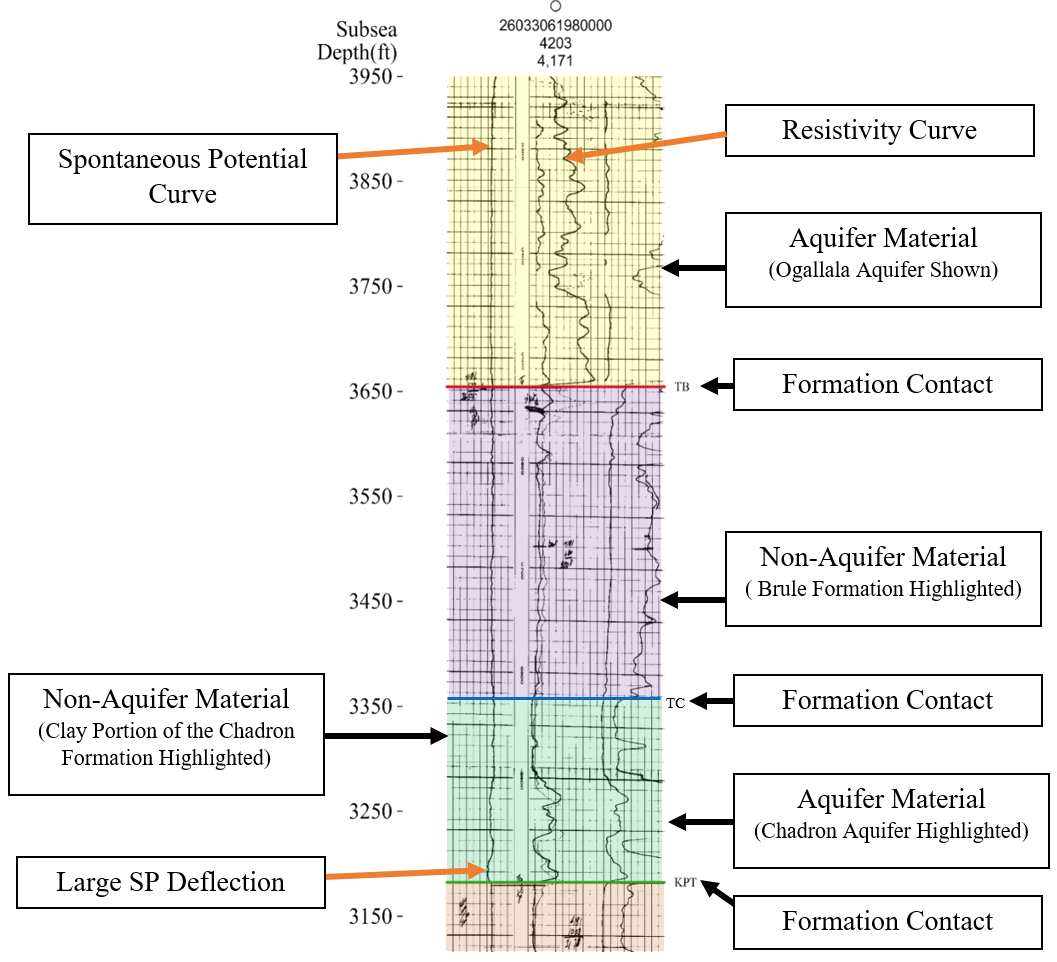
Geophysical logs are like underground X-rays. Oil and gas wells are logged with instruments that measure the electrical properties of the rock. Aquifer materials (sand, gravel, sandstone) show high resistivity and clear deflections on the logs, making them easy to spot compared to tight clays and shales. This high-tech detective work let the team map the aquifer’s base with far greater confidence than ever before.
This was an actual geophysical log using in the interpretation with the resistivity curve (which indicates material type) and the spontaneous potential (SP) curve (which indicates permeability). The aquifers and formations are highlighed in different colors.
Interpretation Complexities: The Challenge of Hidden Layers
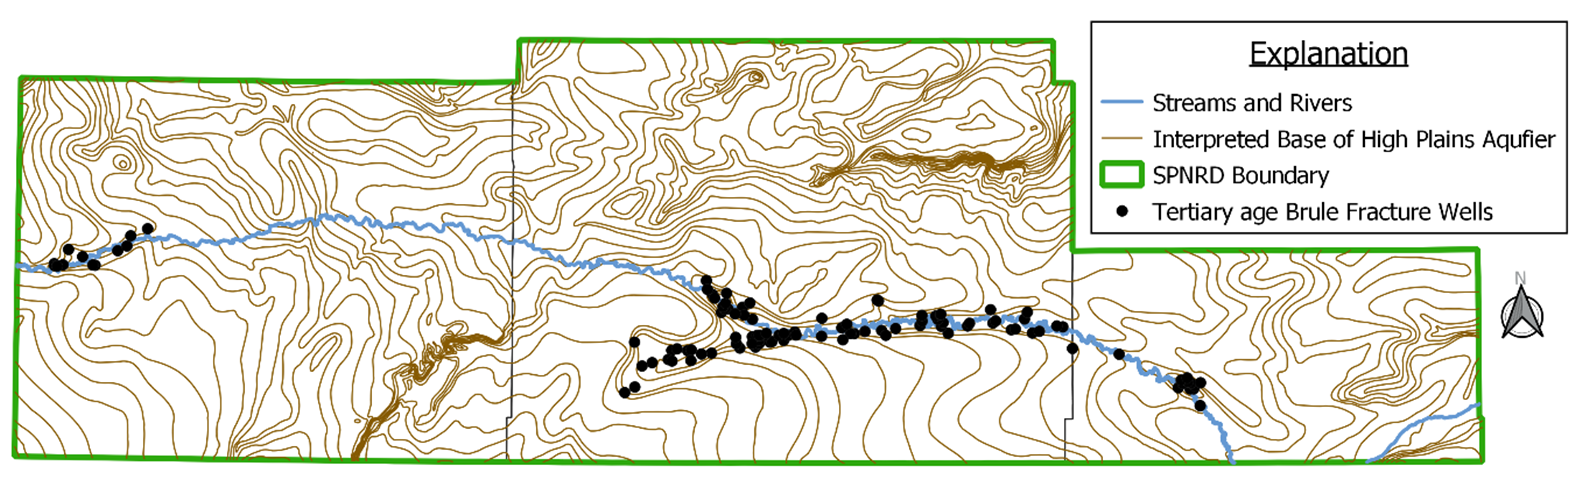
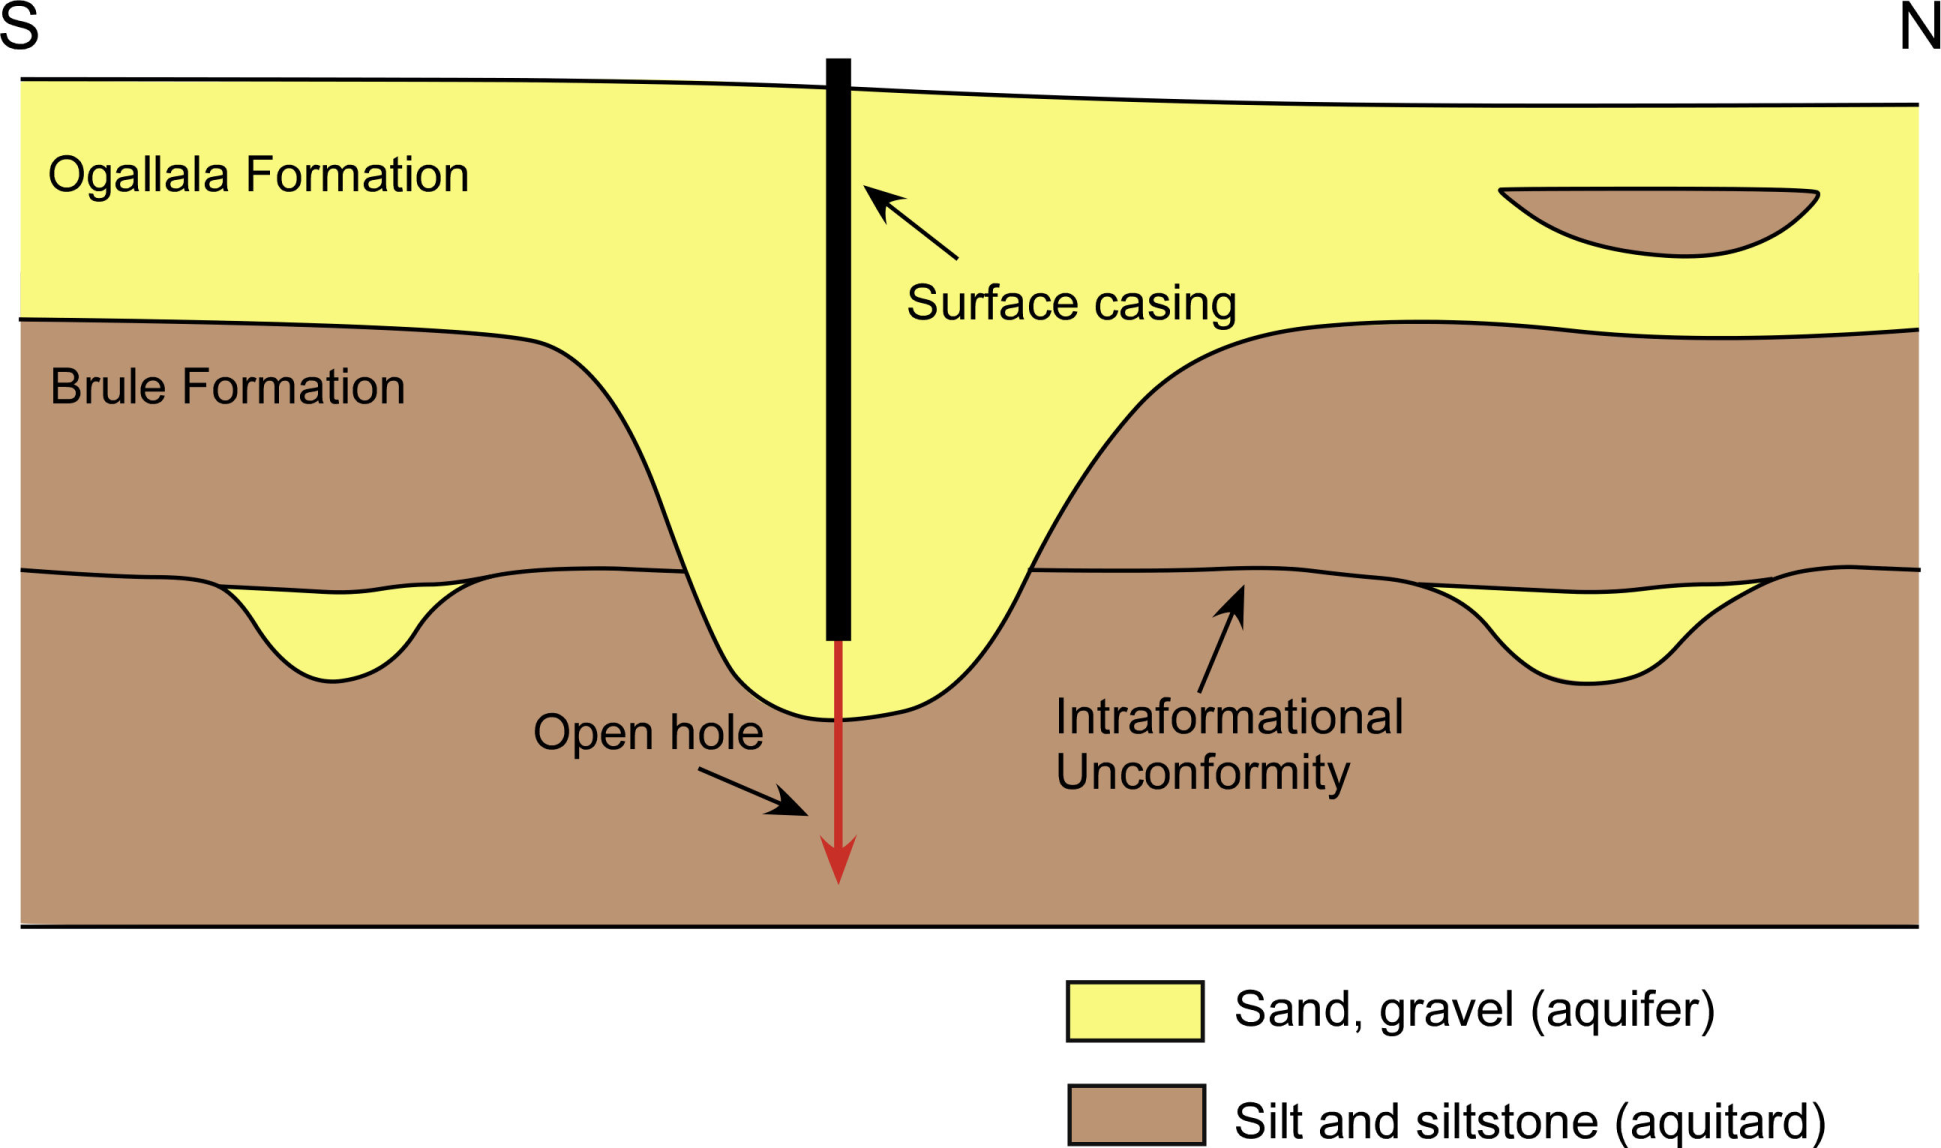
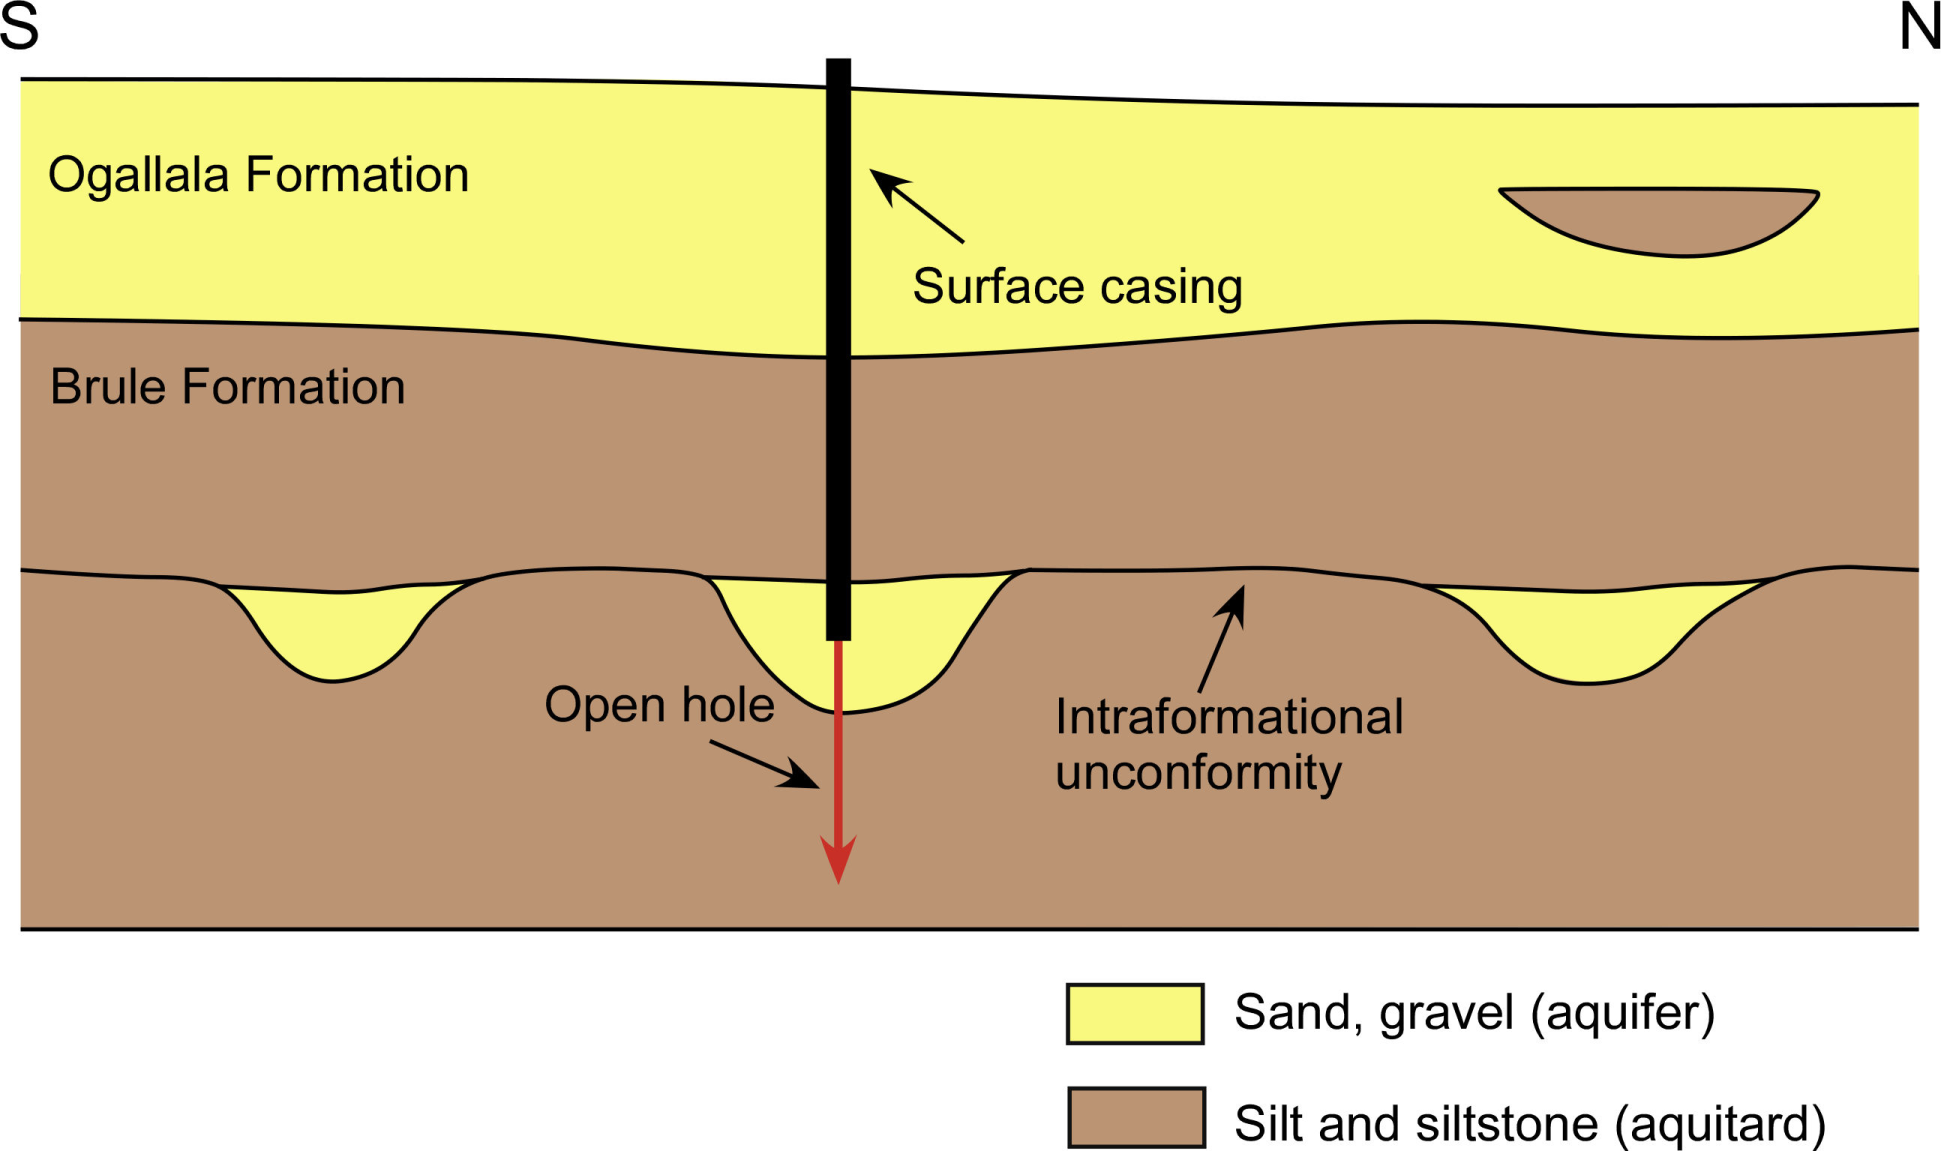
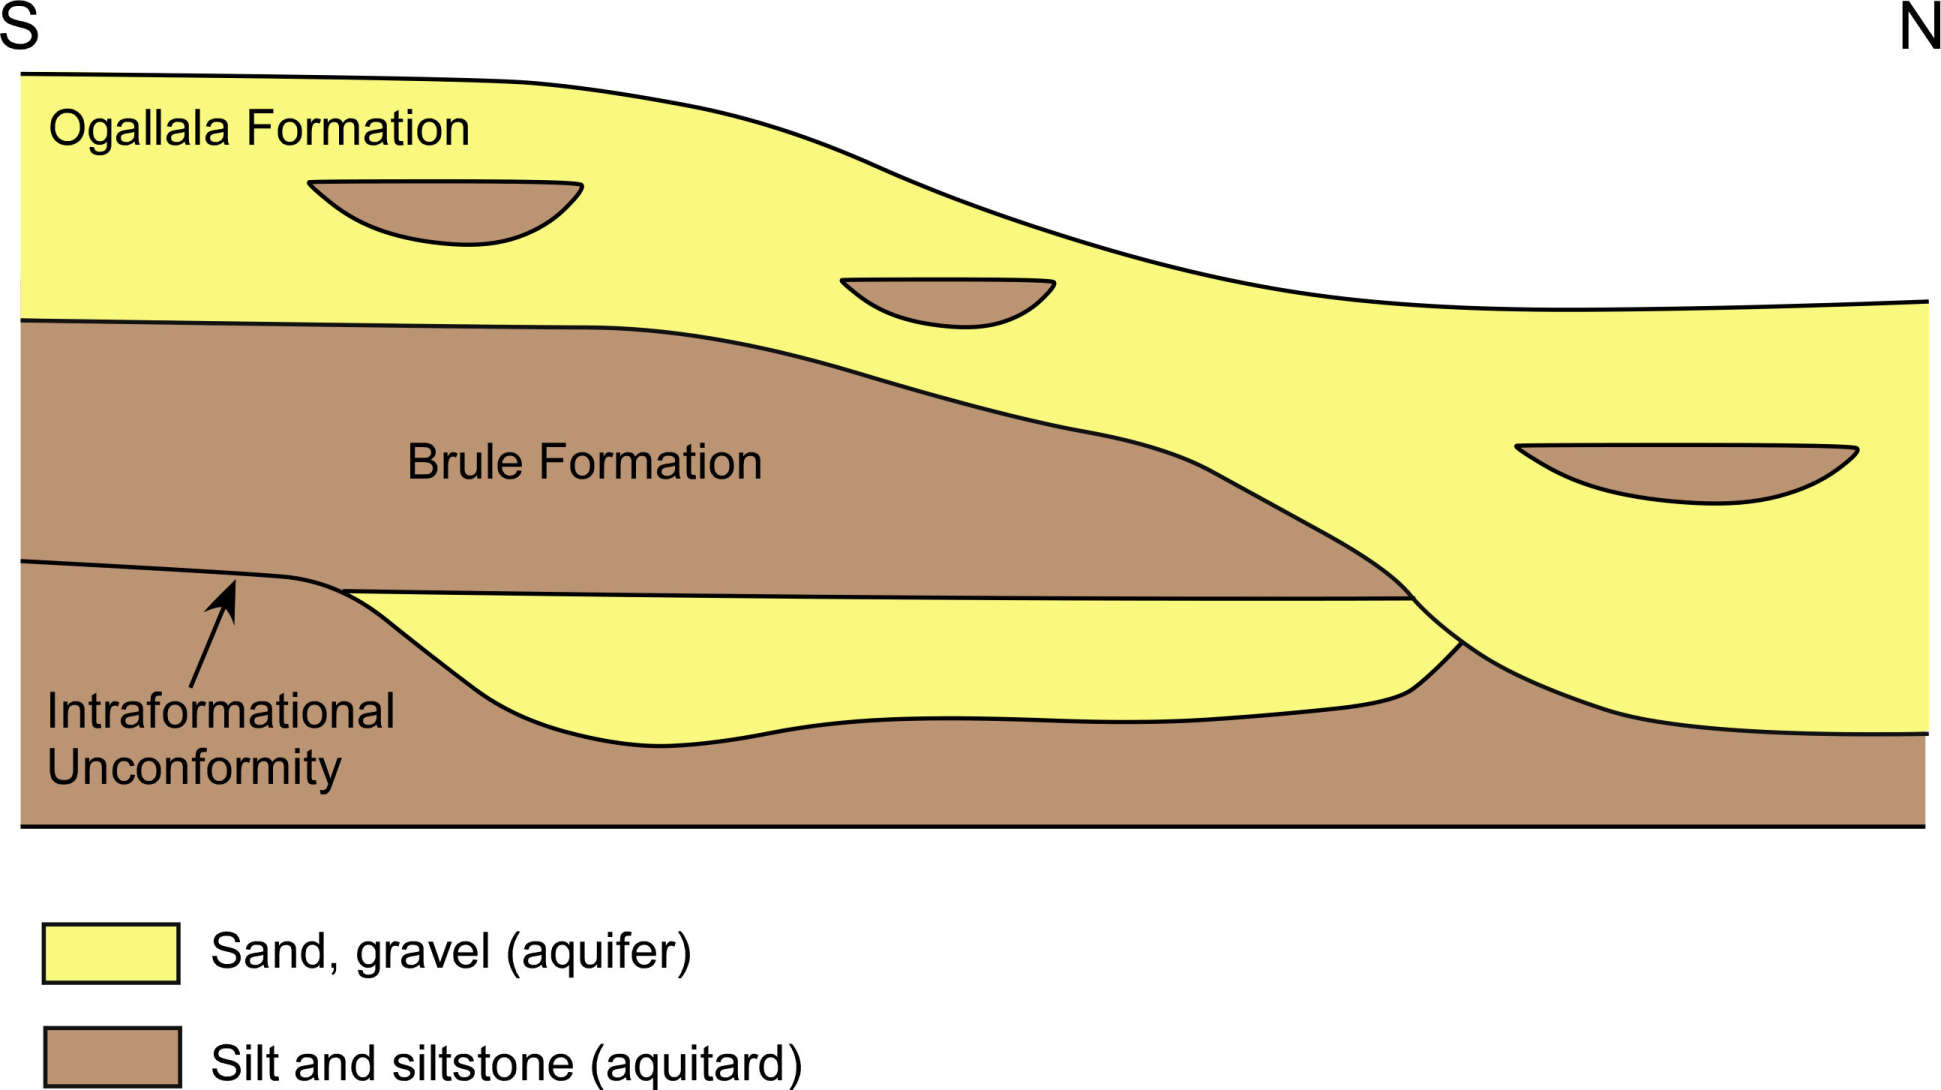
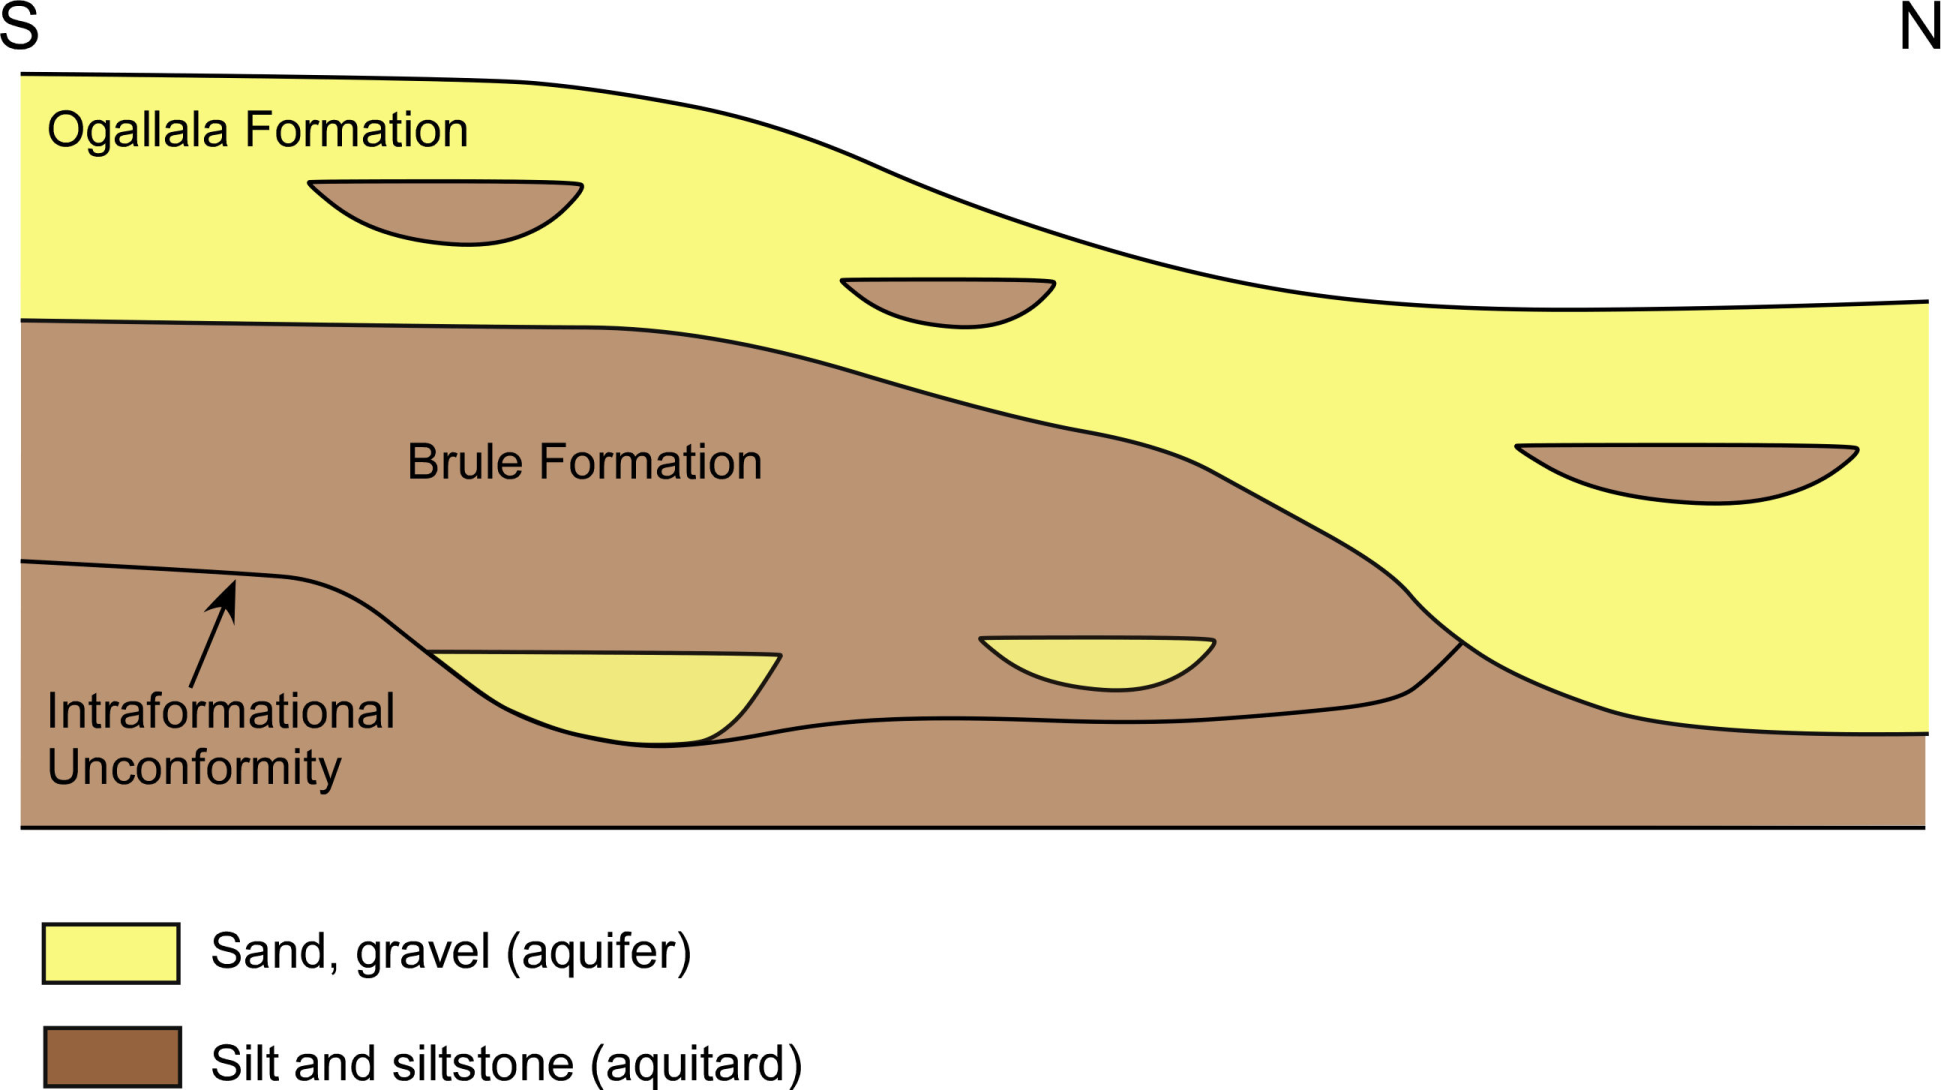
One of the most fascinating (and tricky) parts of the study involved interpretation complexities. Oil and gas companies set steel surface casing early in drilling to protect fresh ground water before going deeper. Because the upper portion of the hole is cased off, it is rarely logged — leaving a “blind spot” right where shallow secondary aquifers or paleochannel deposits might sit.
This challenge is especially pronounced in Kimball and Cheyenne counties, where significant sand and gravel lenses were deposited in ancient paleochannels within the Brule Formation. Below the casing, geologists sometimes see aquifer material that could be interpreted in more than one way. The study team used multiple expert reviews, structural cross sections, and supporting data (including chemical analyses from earlier work) to sort through these possibilities.
INTERPRETATION POSSIBILITIES
Multiple Ways to Interpret the Same Log
The same geophysical log can support different geologic interpretations depending on how the geologist connects the aquifer materials. These four figures show the range of possibilities the team considered.
Ogallala Channel Sand Interpretation (Figure 2 from the study)
Key Results & Lasting Impact
The study produced a refined contour map of the base of the High Plains Aquifer surface that captures deep paleochannels and the sometimes-tricky connections between the main Ogallala aquifer and certain Brule Formation sands and gravels. It also generated detailed geologic cross sections that reveal the three-dimensional architecture of the aquifer system.
These advances make our regional ground water models more reliable and give water managers the high-quality data they need for ground water planning and management across the southern Nebraska Panhandle.
Explore the Geologic Cross Sections
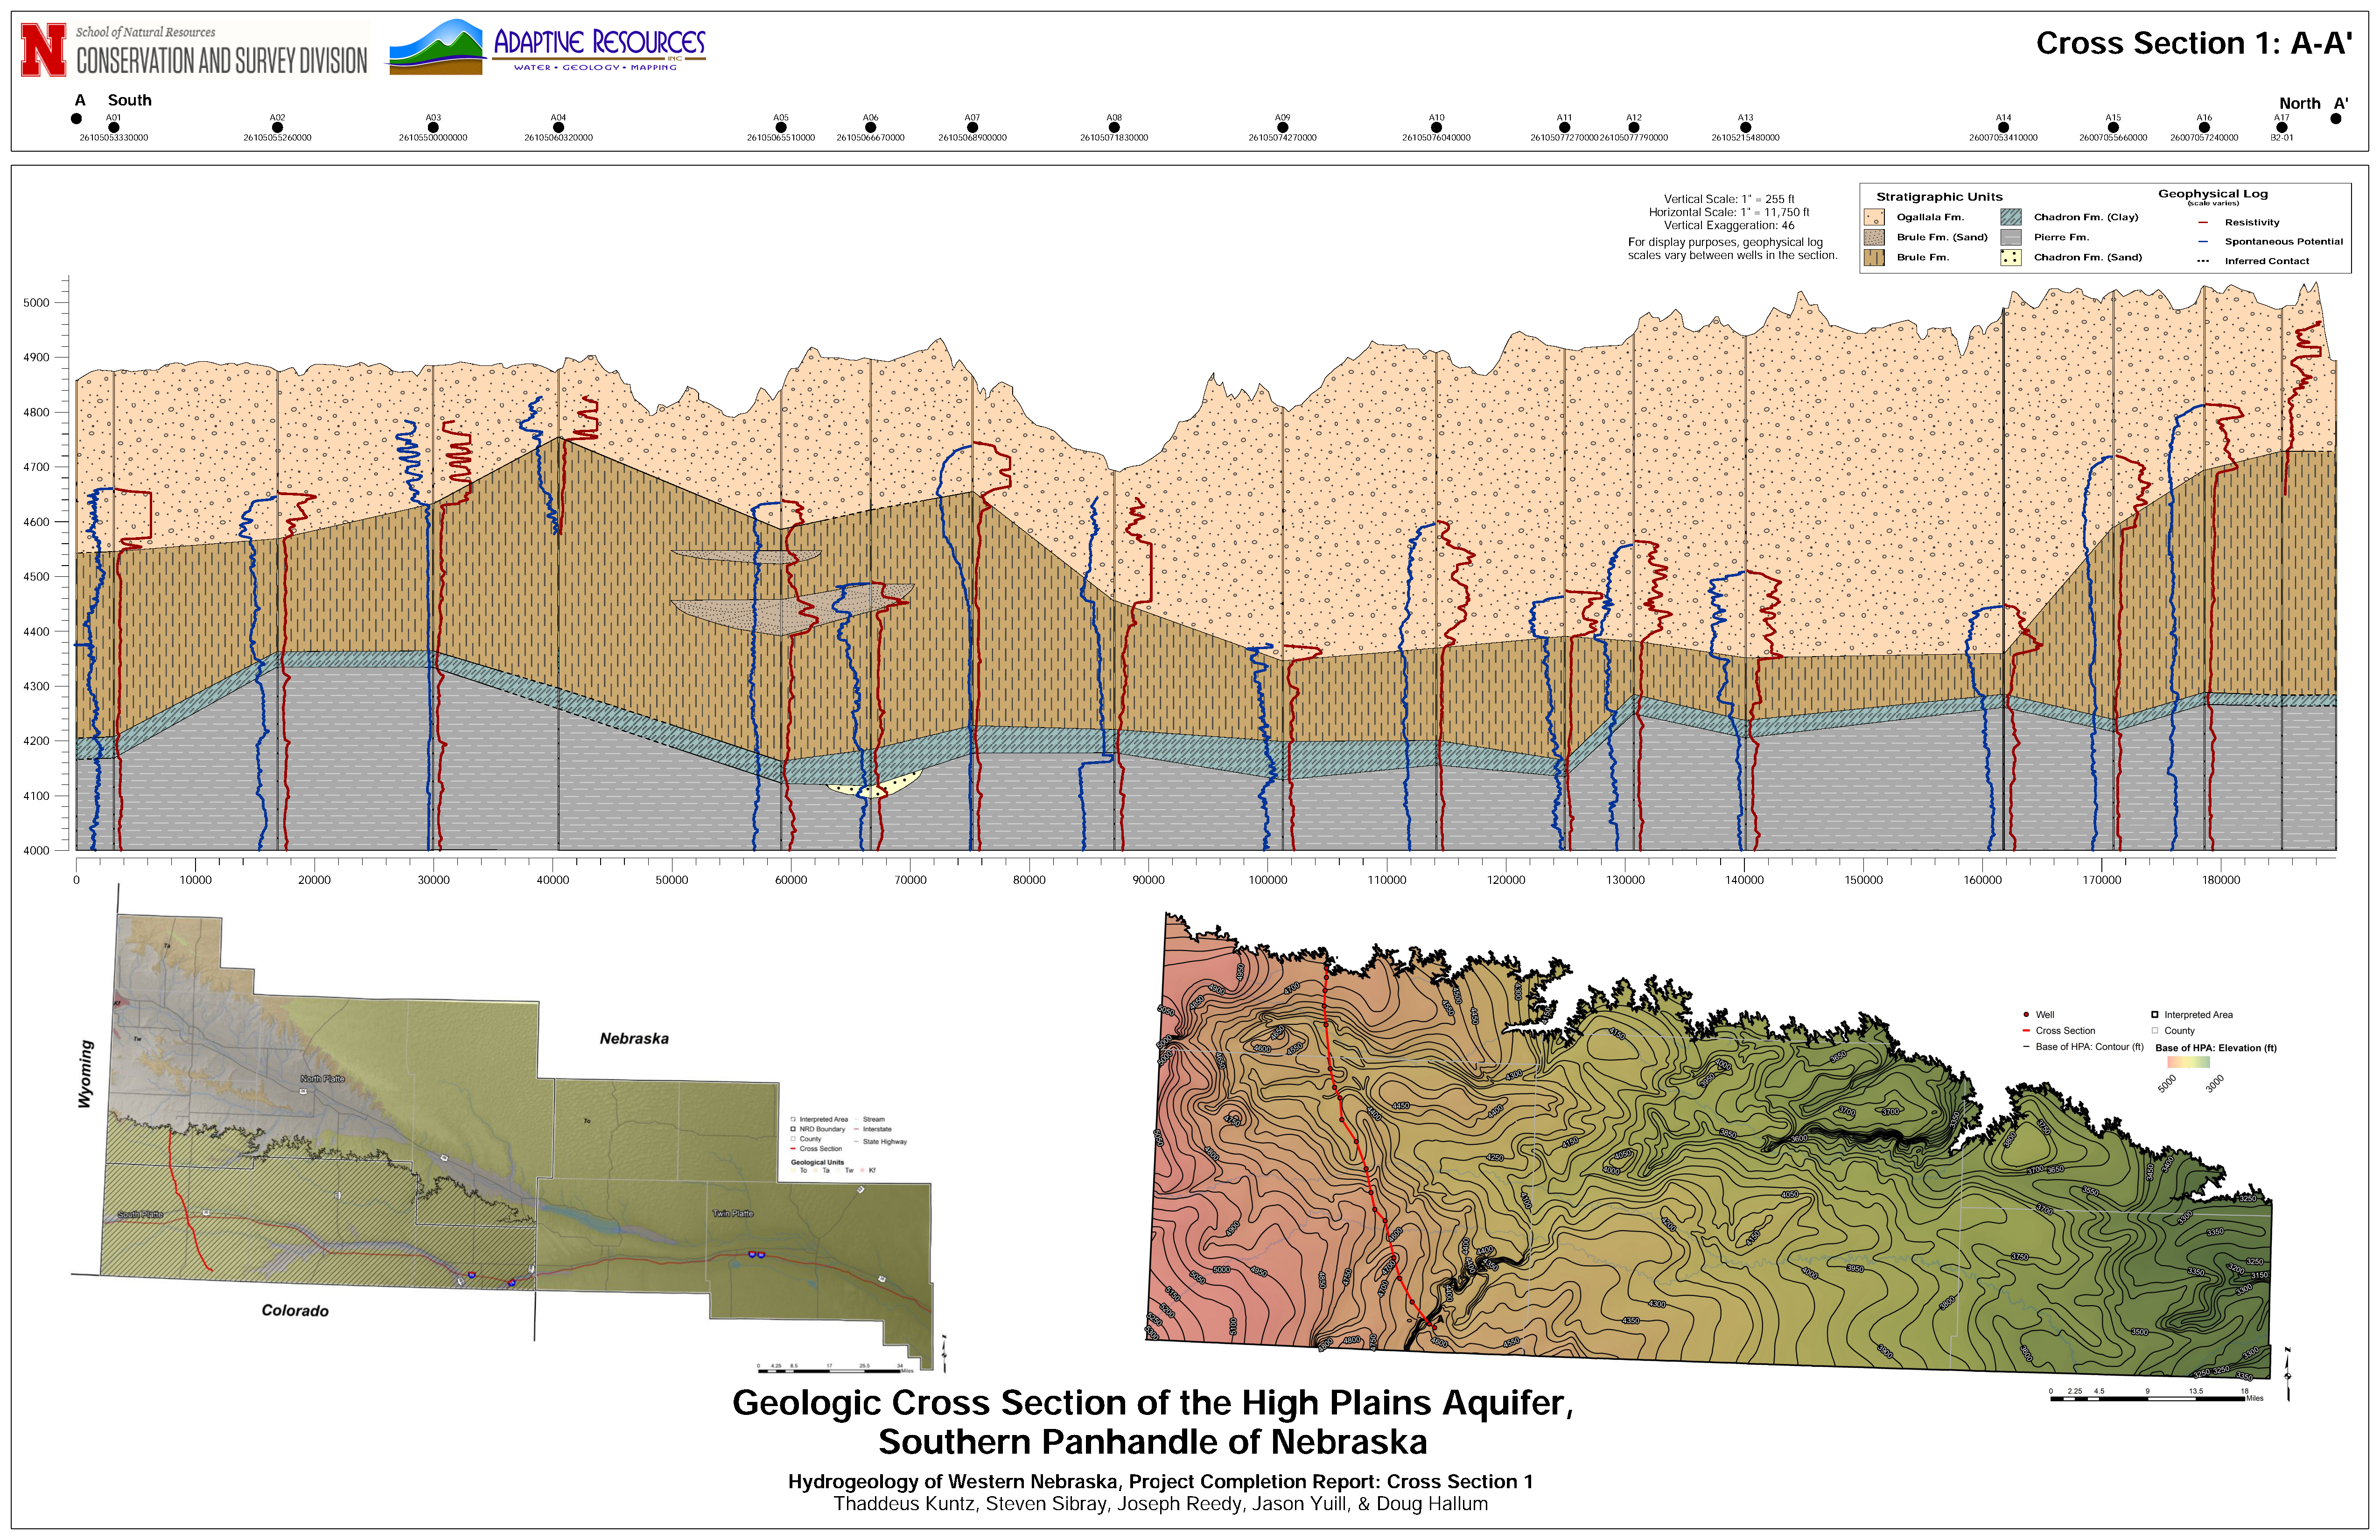
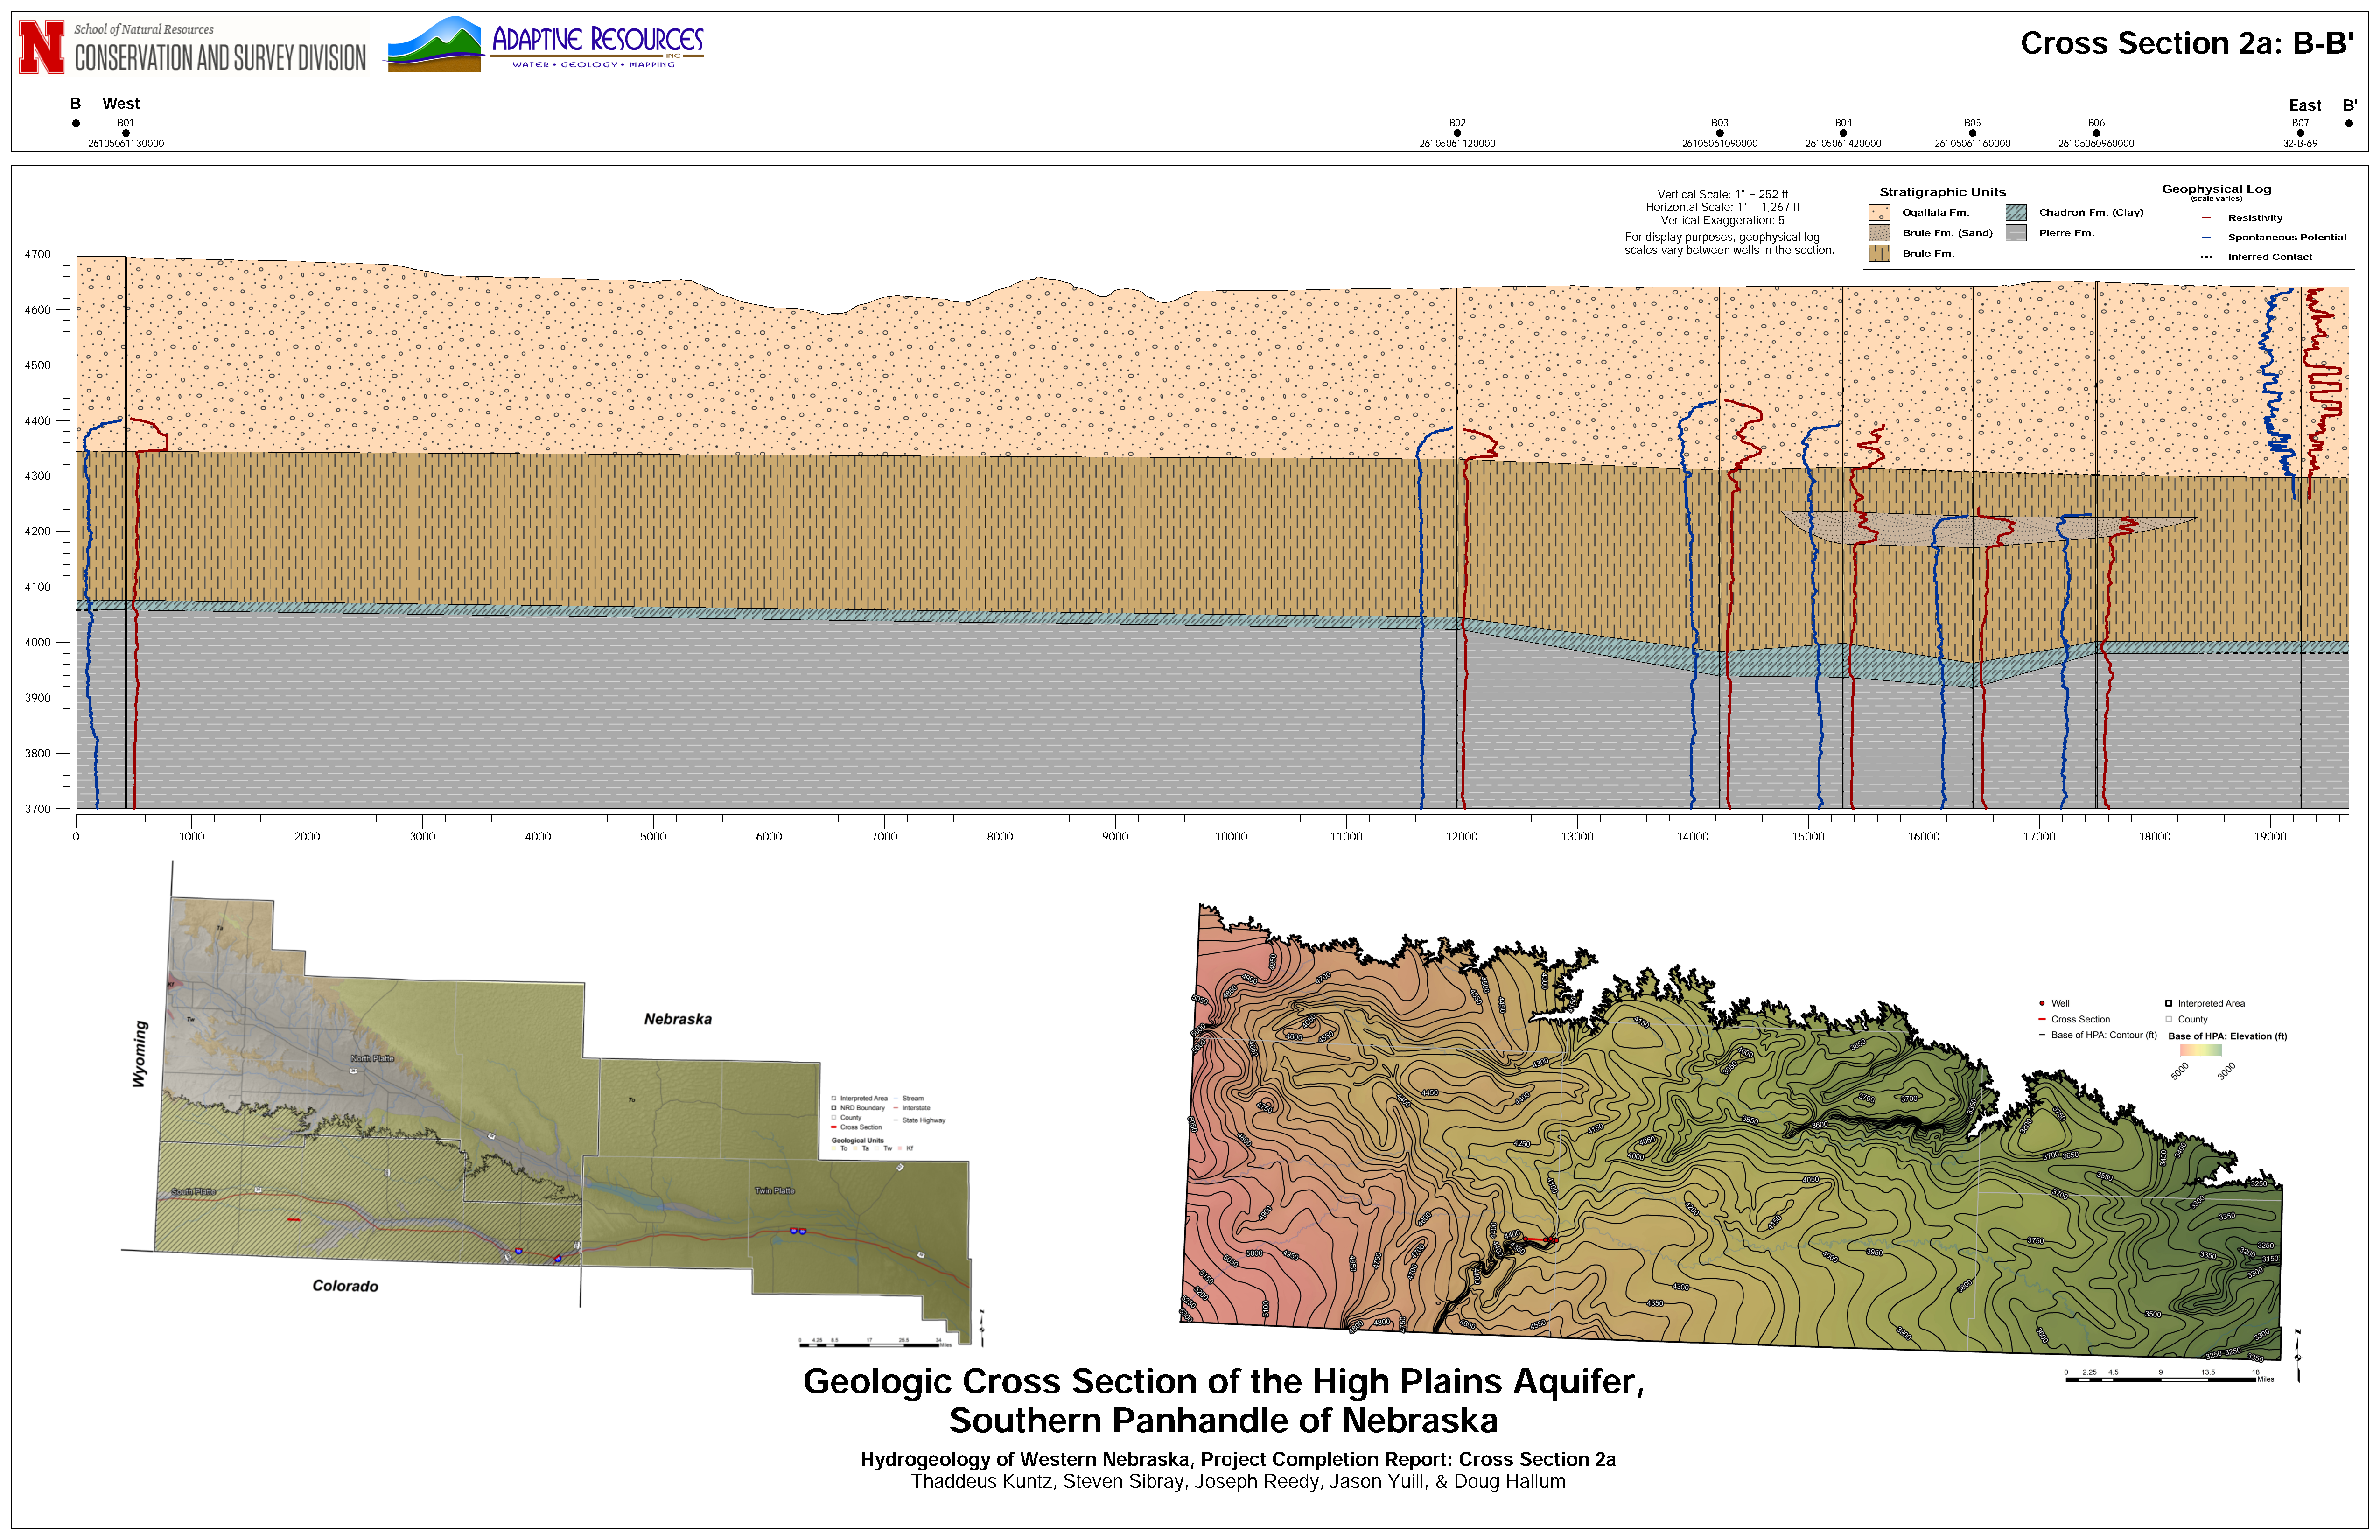
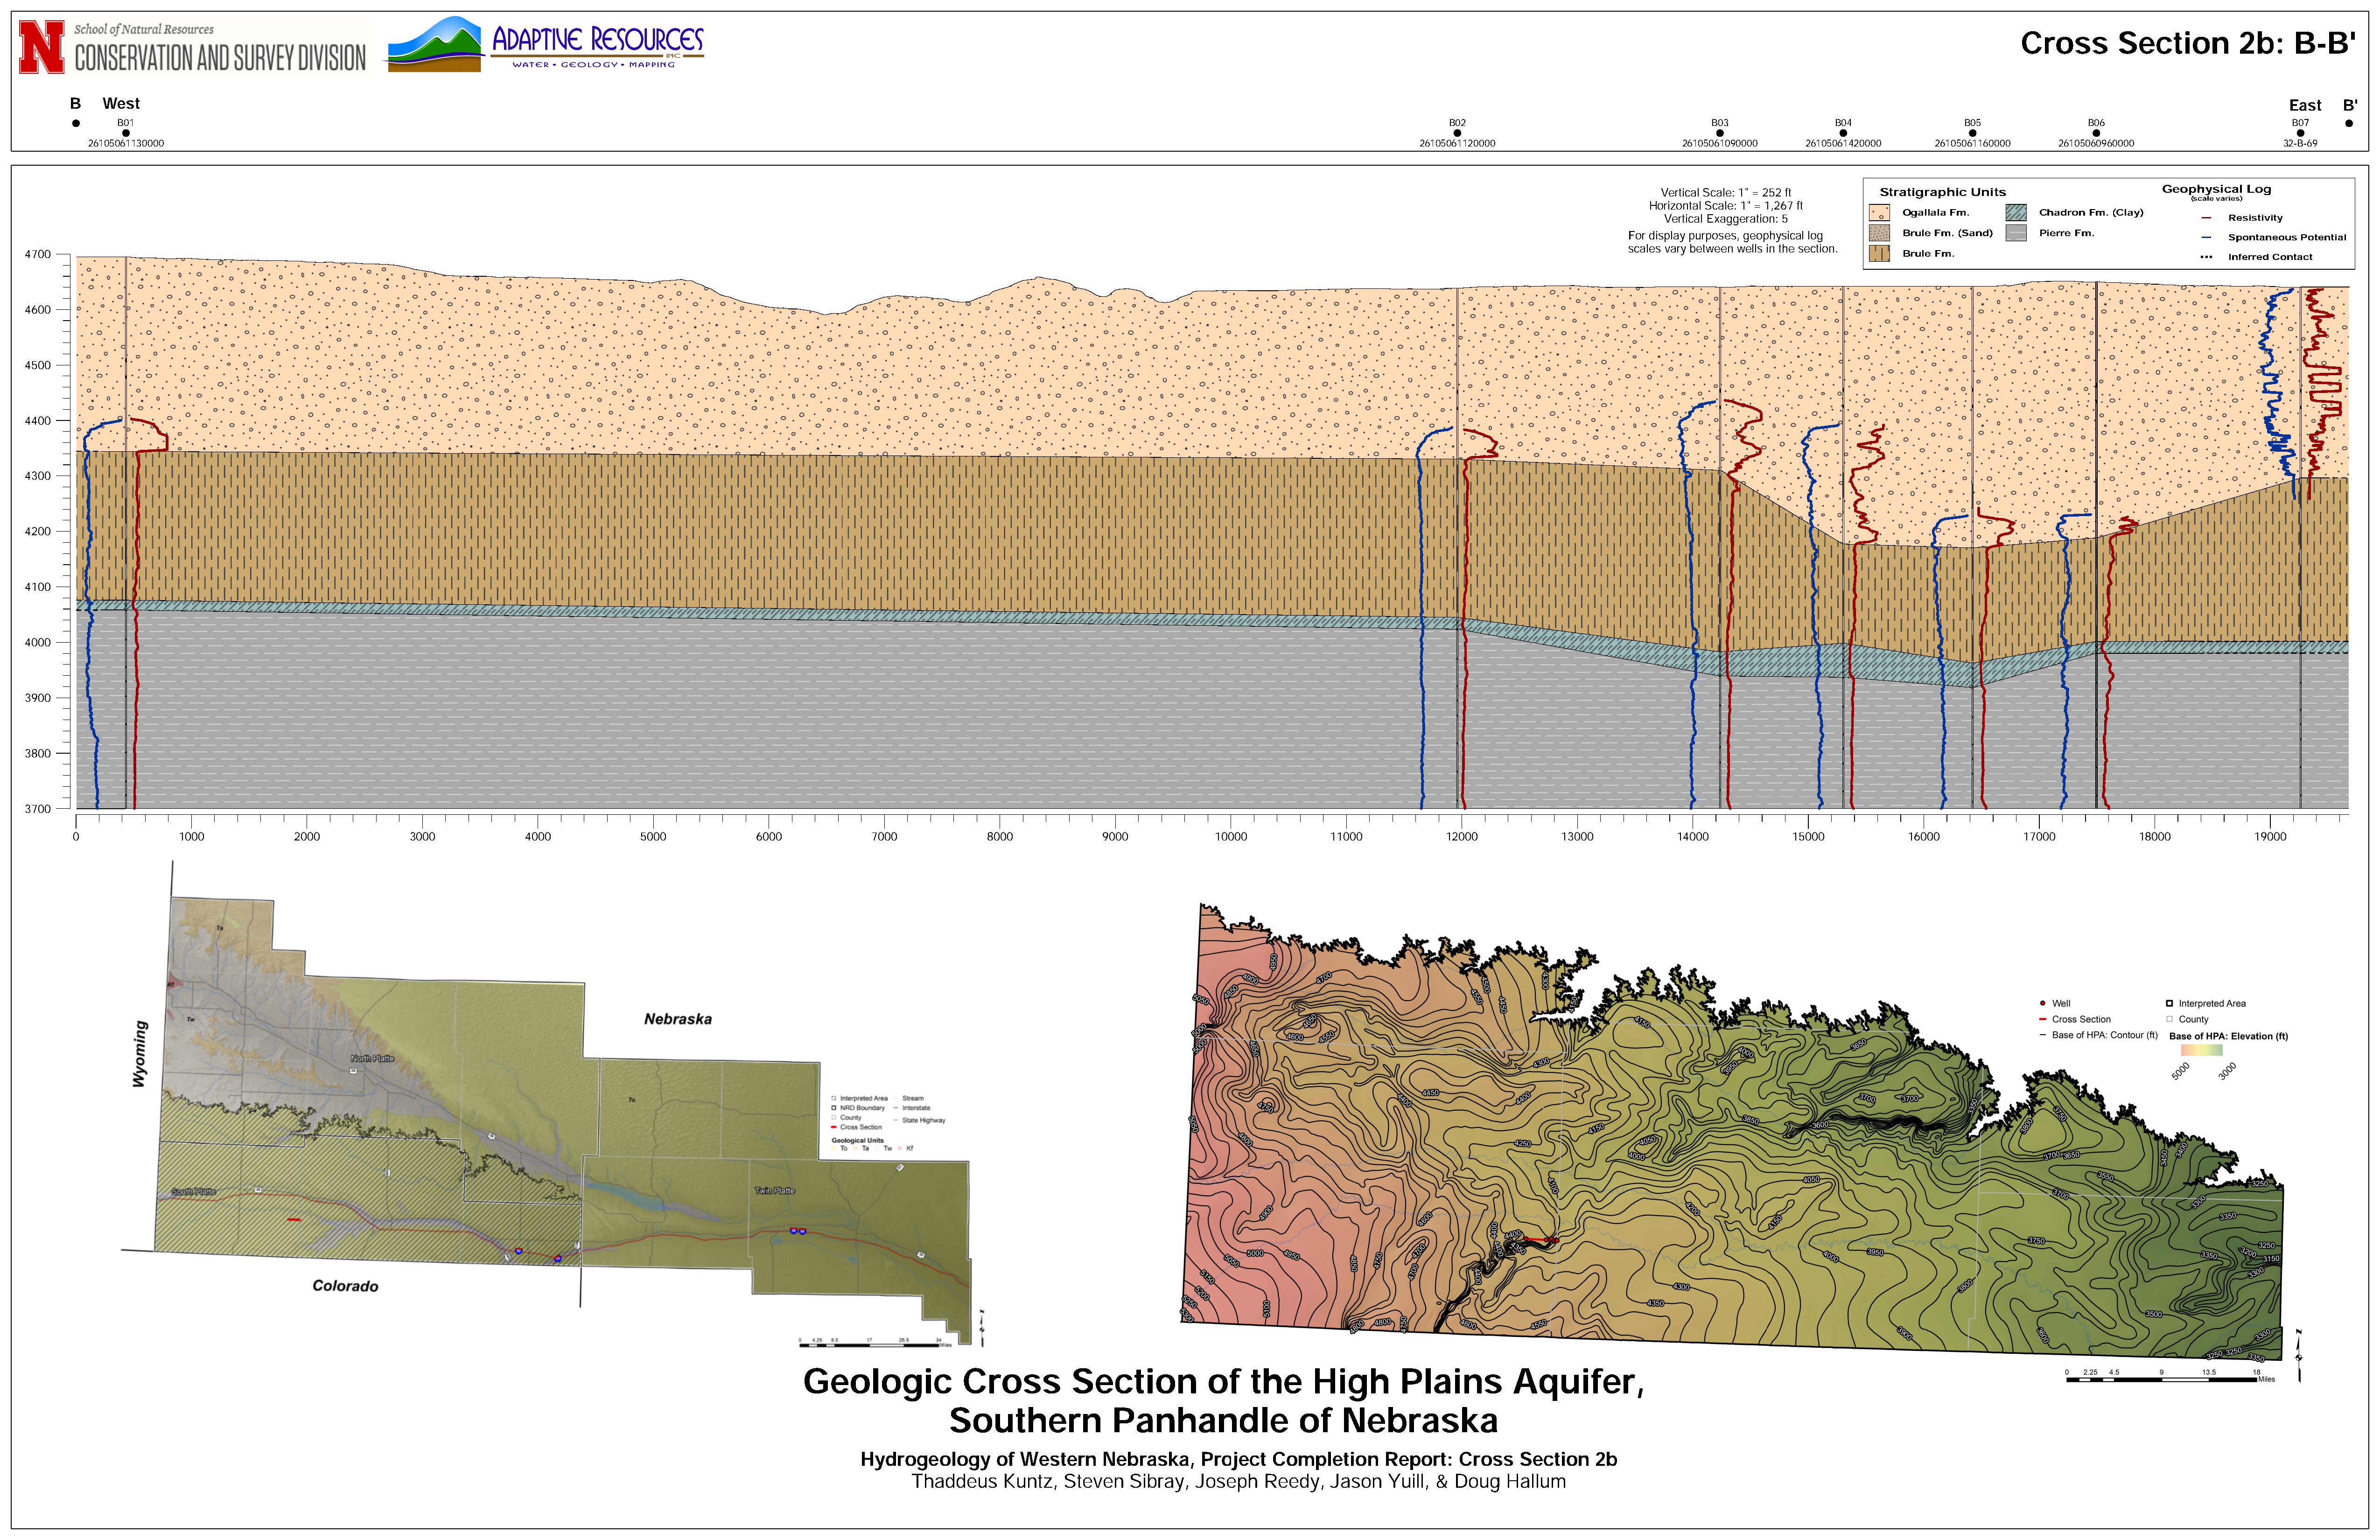
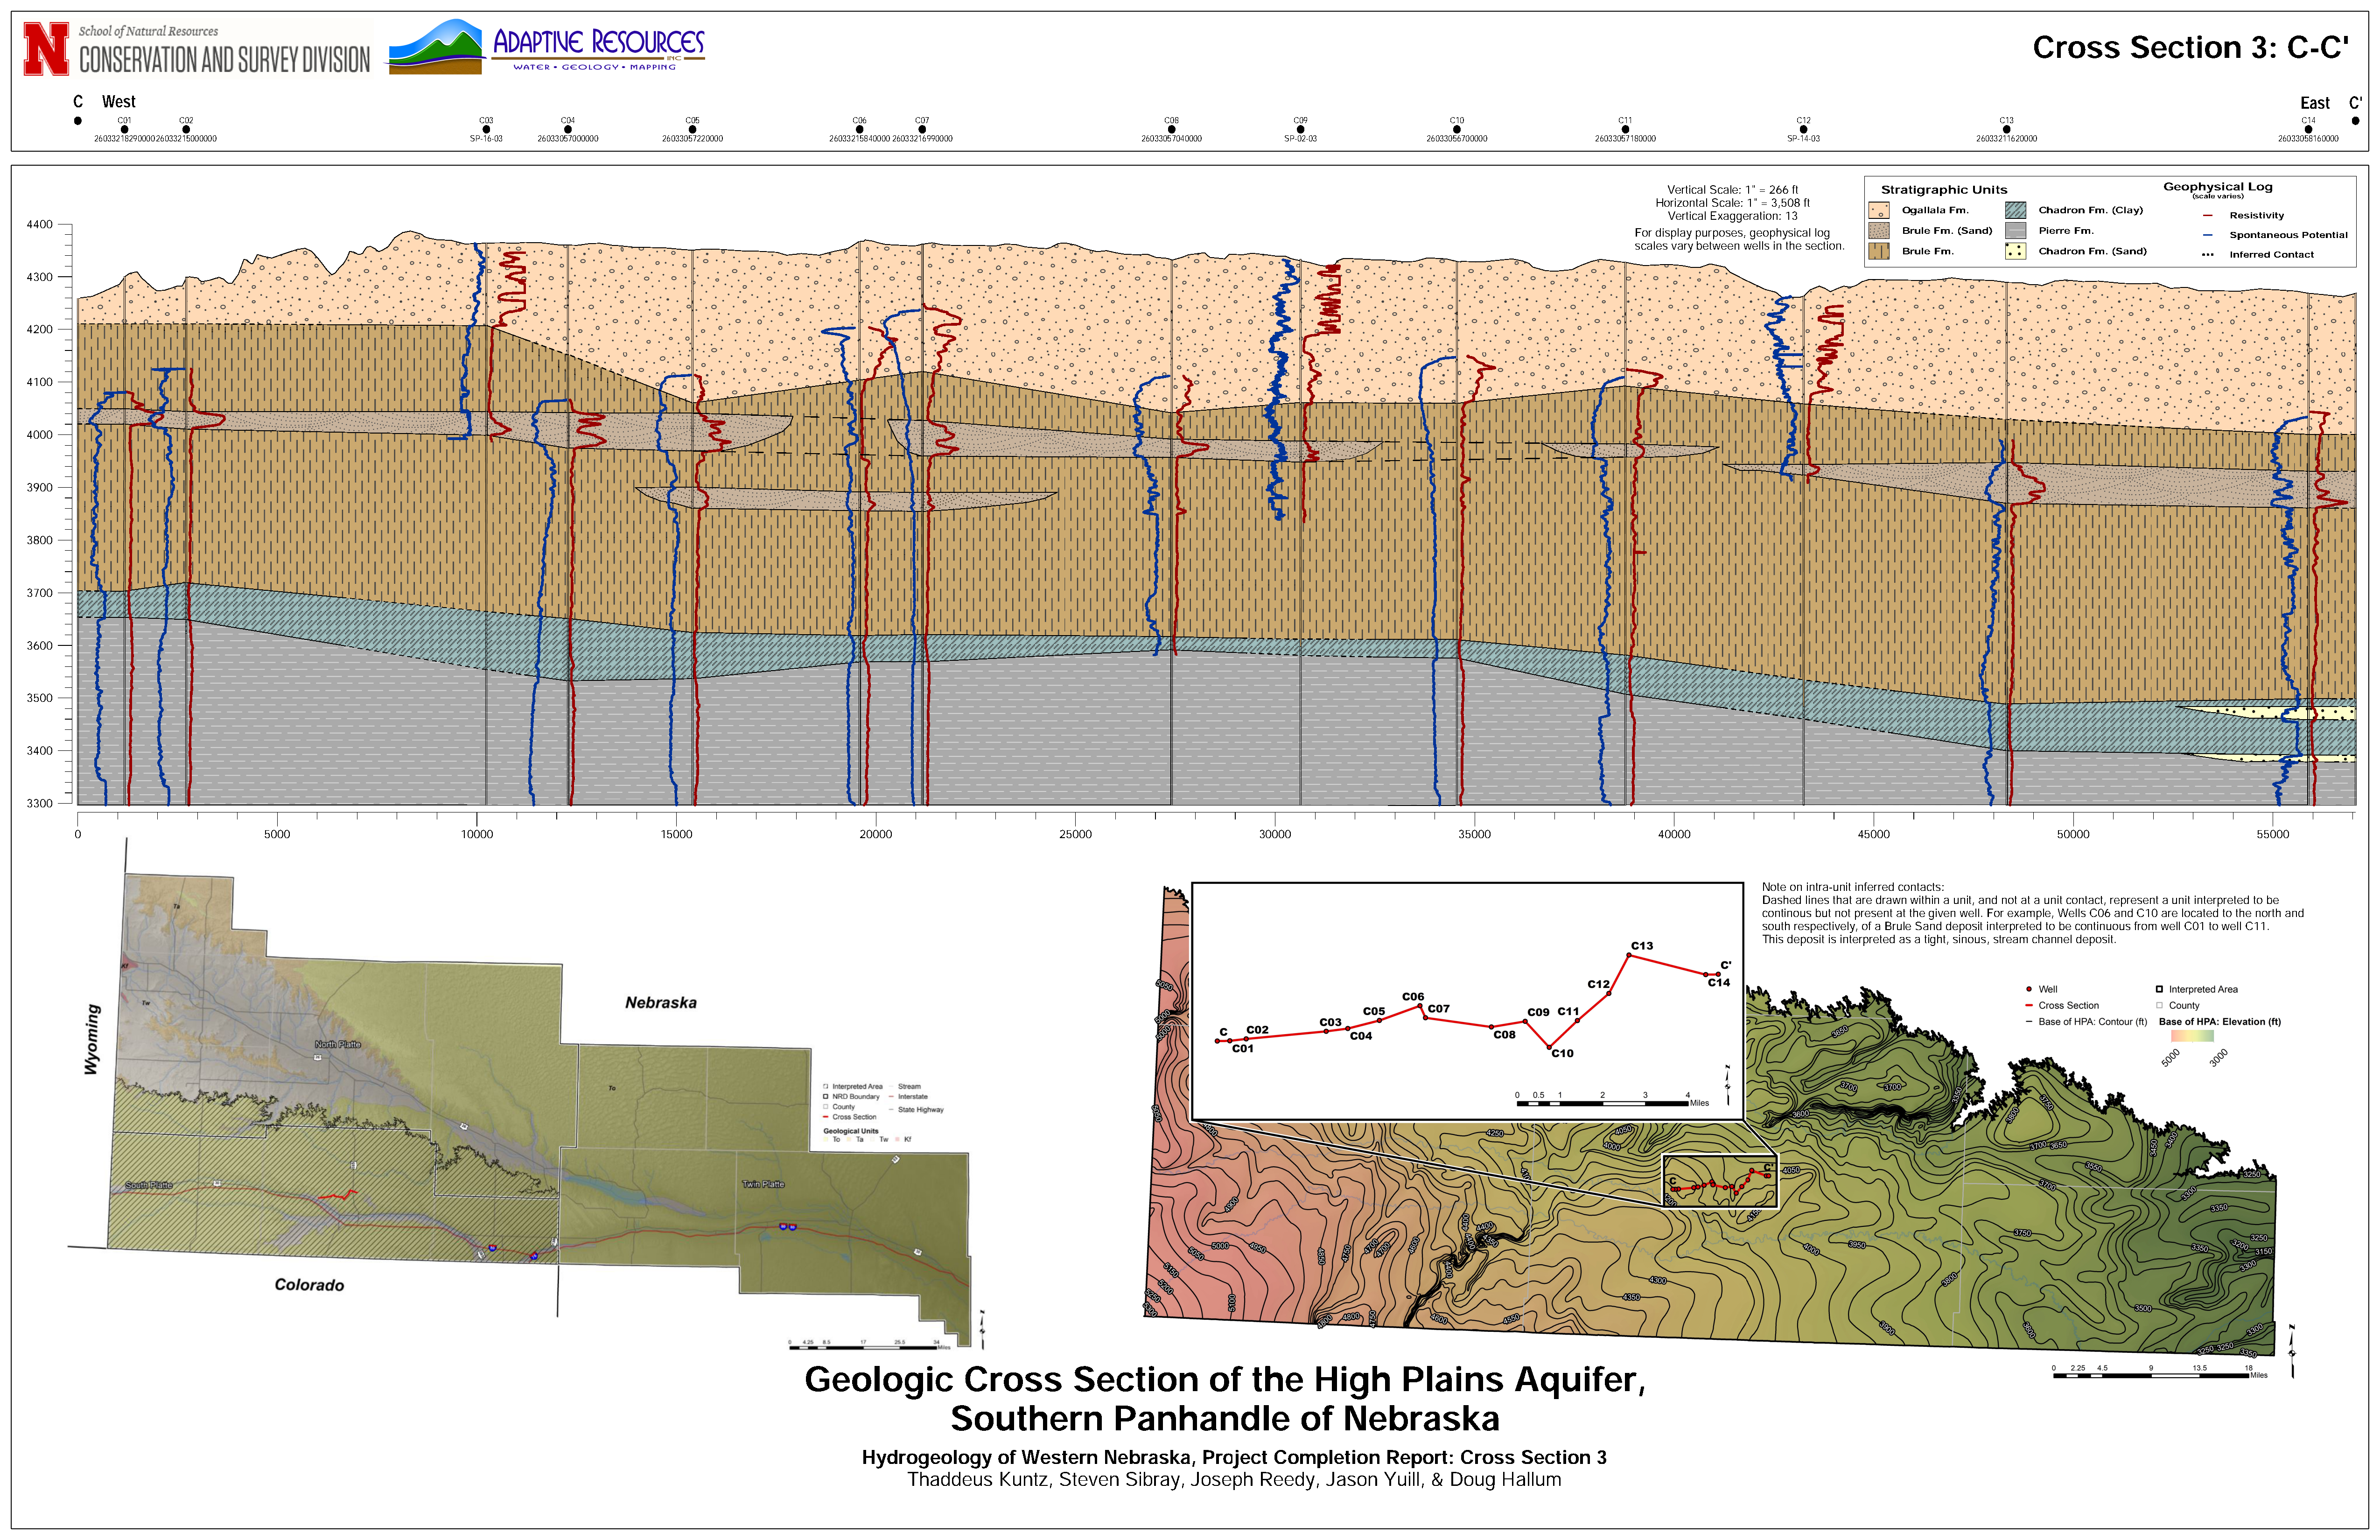
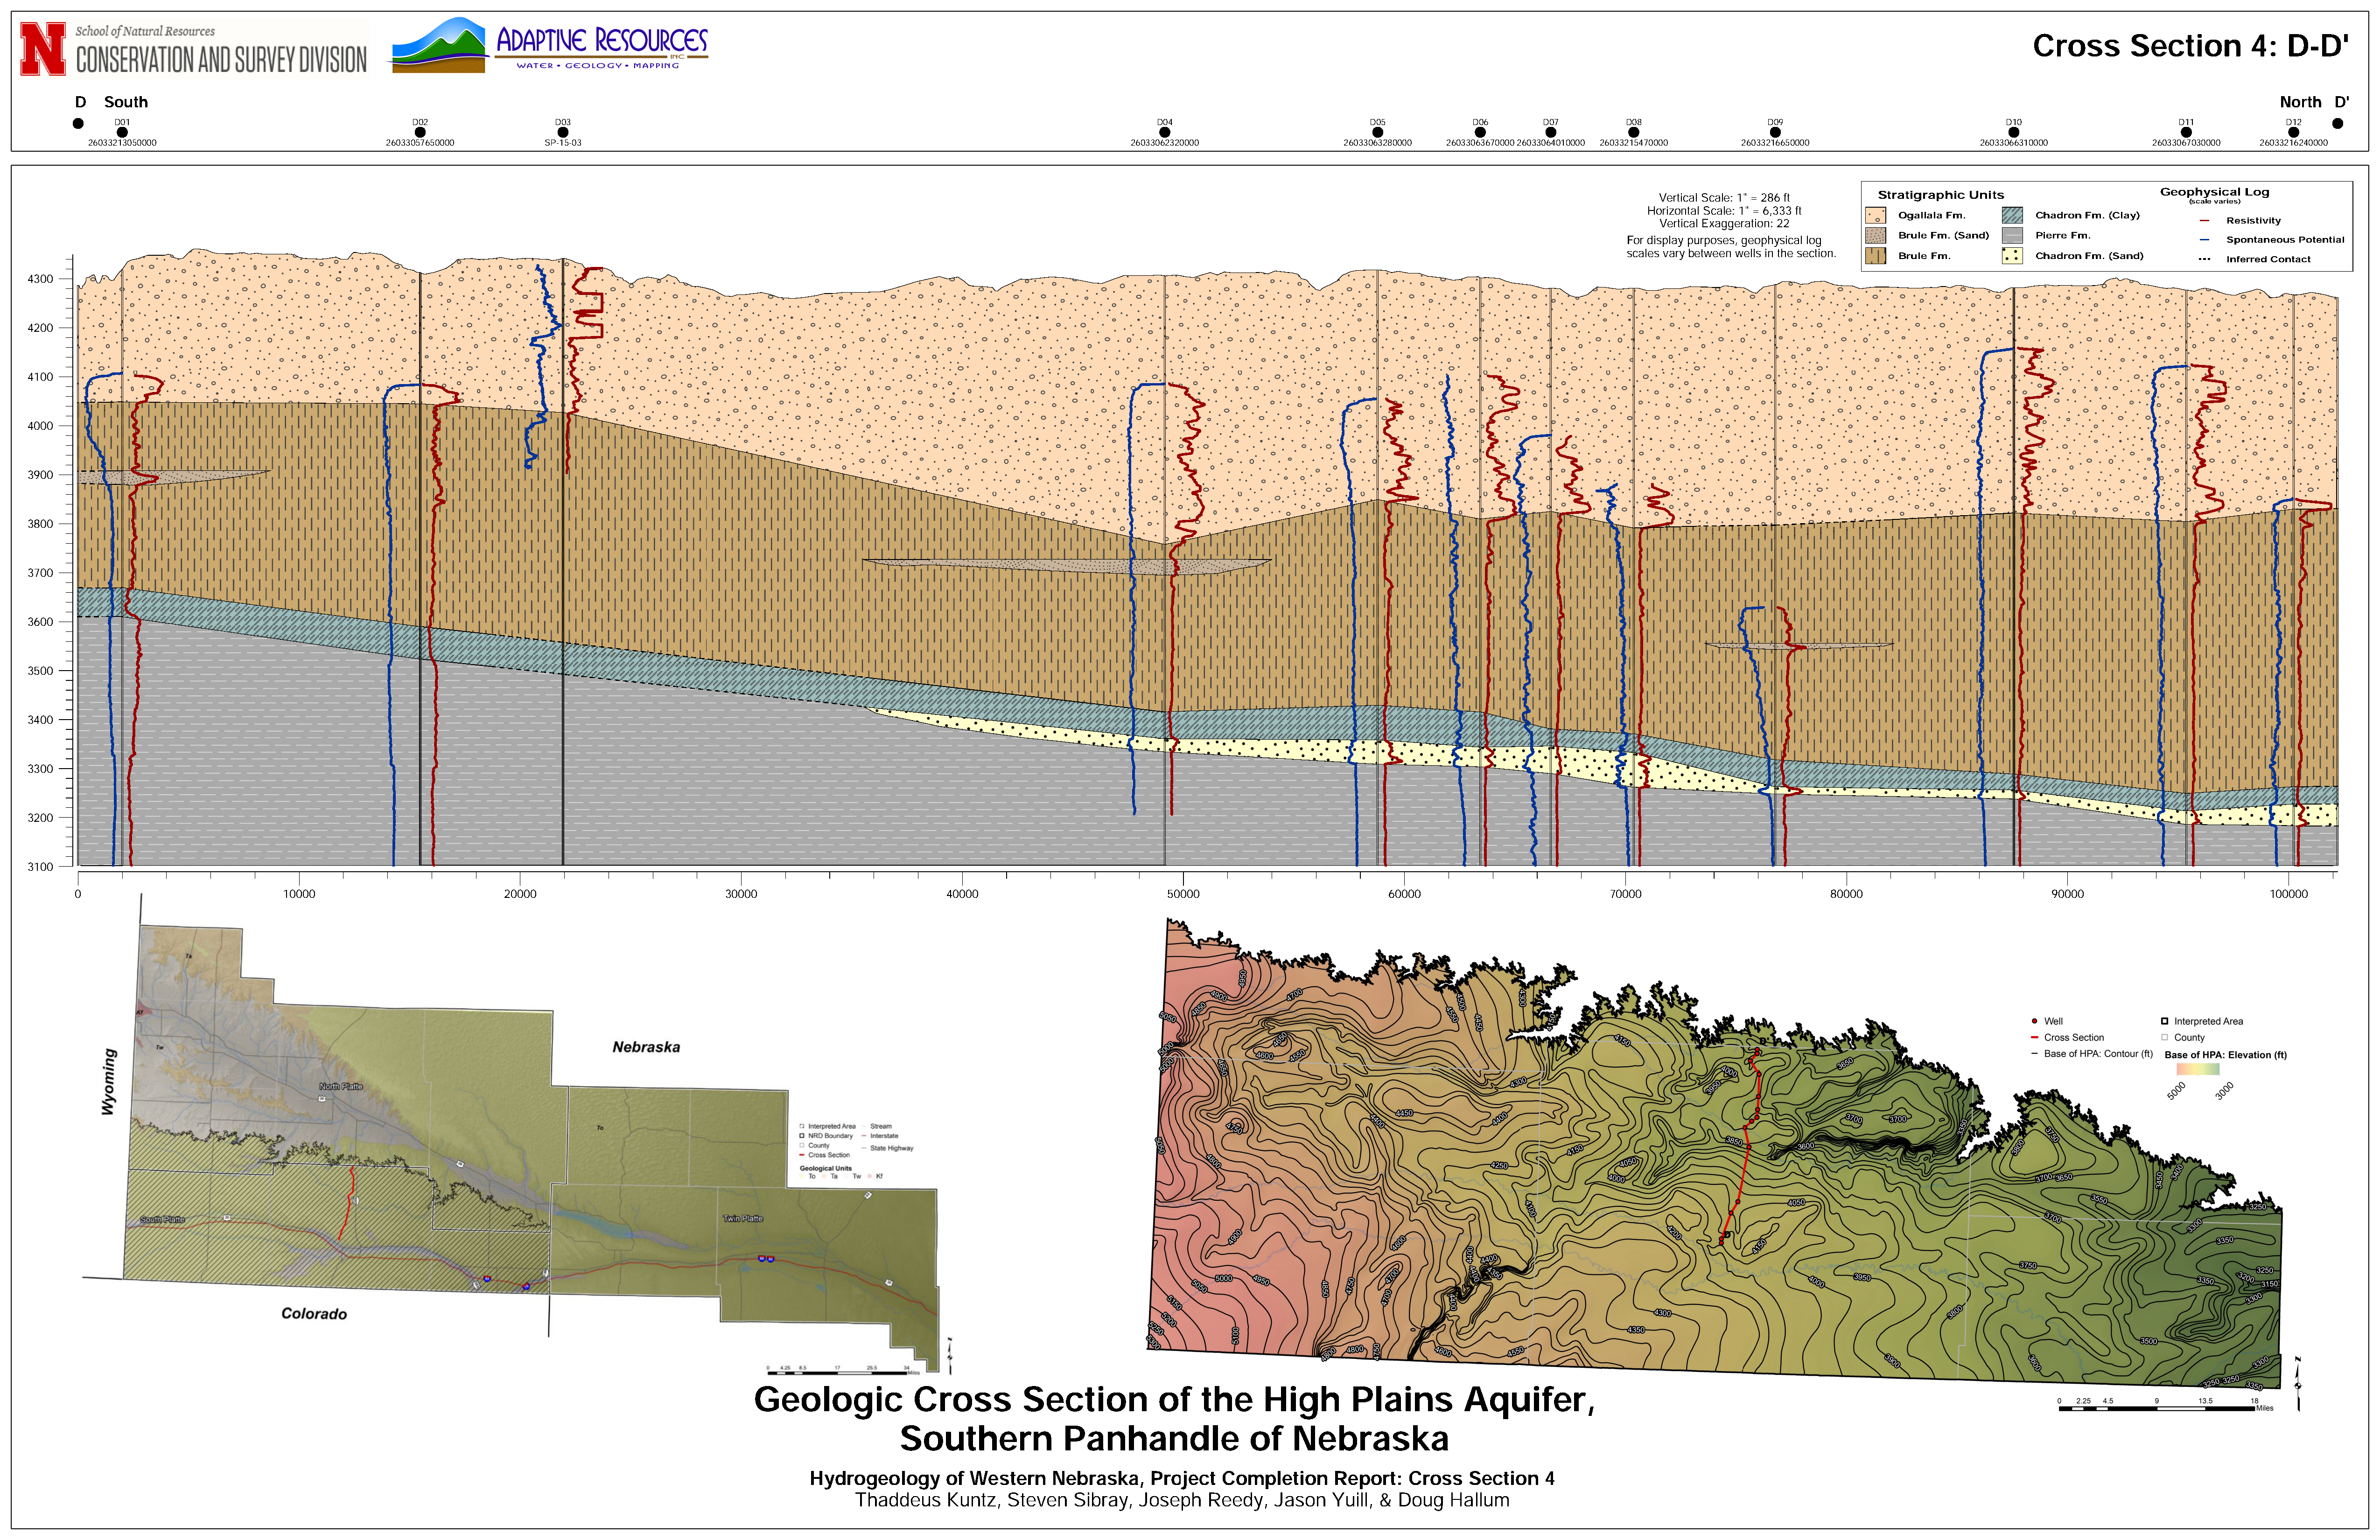
The study created numerous detailed cross sections that slice through the subsurface like a giant layer cake. They beautifully illustrate the varying thickness of the aquifer, ancient river channels, and the relationships between different geologic layers.
CROSS SECTIONS 1–4
Geologic Cross Sections
Click any cross section below to open a large, navigable viewer. Use the arrows to cycle through all five detailed views.
Cross Sections from the 2020 Hydrogeology of Western Nebraska Project Completion Report
Visualizing the Aquifer Base: The Landmark Interpreted Map
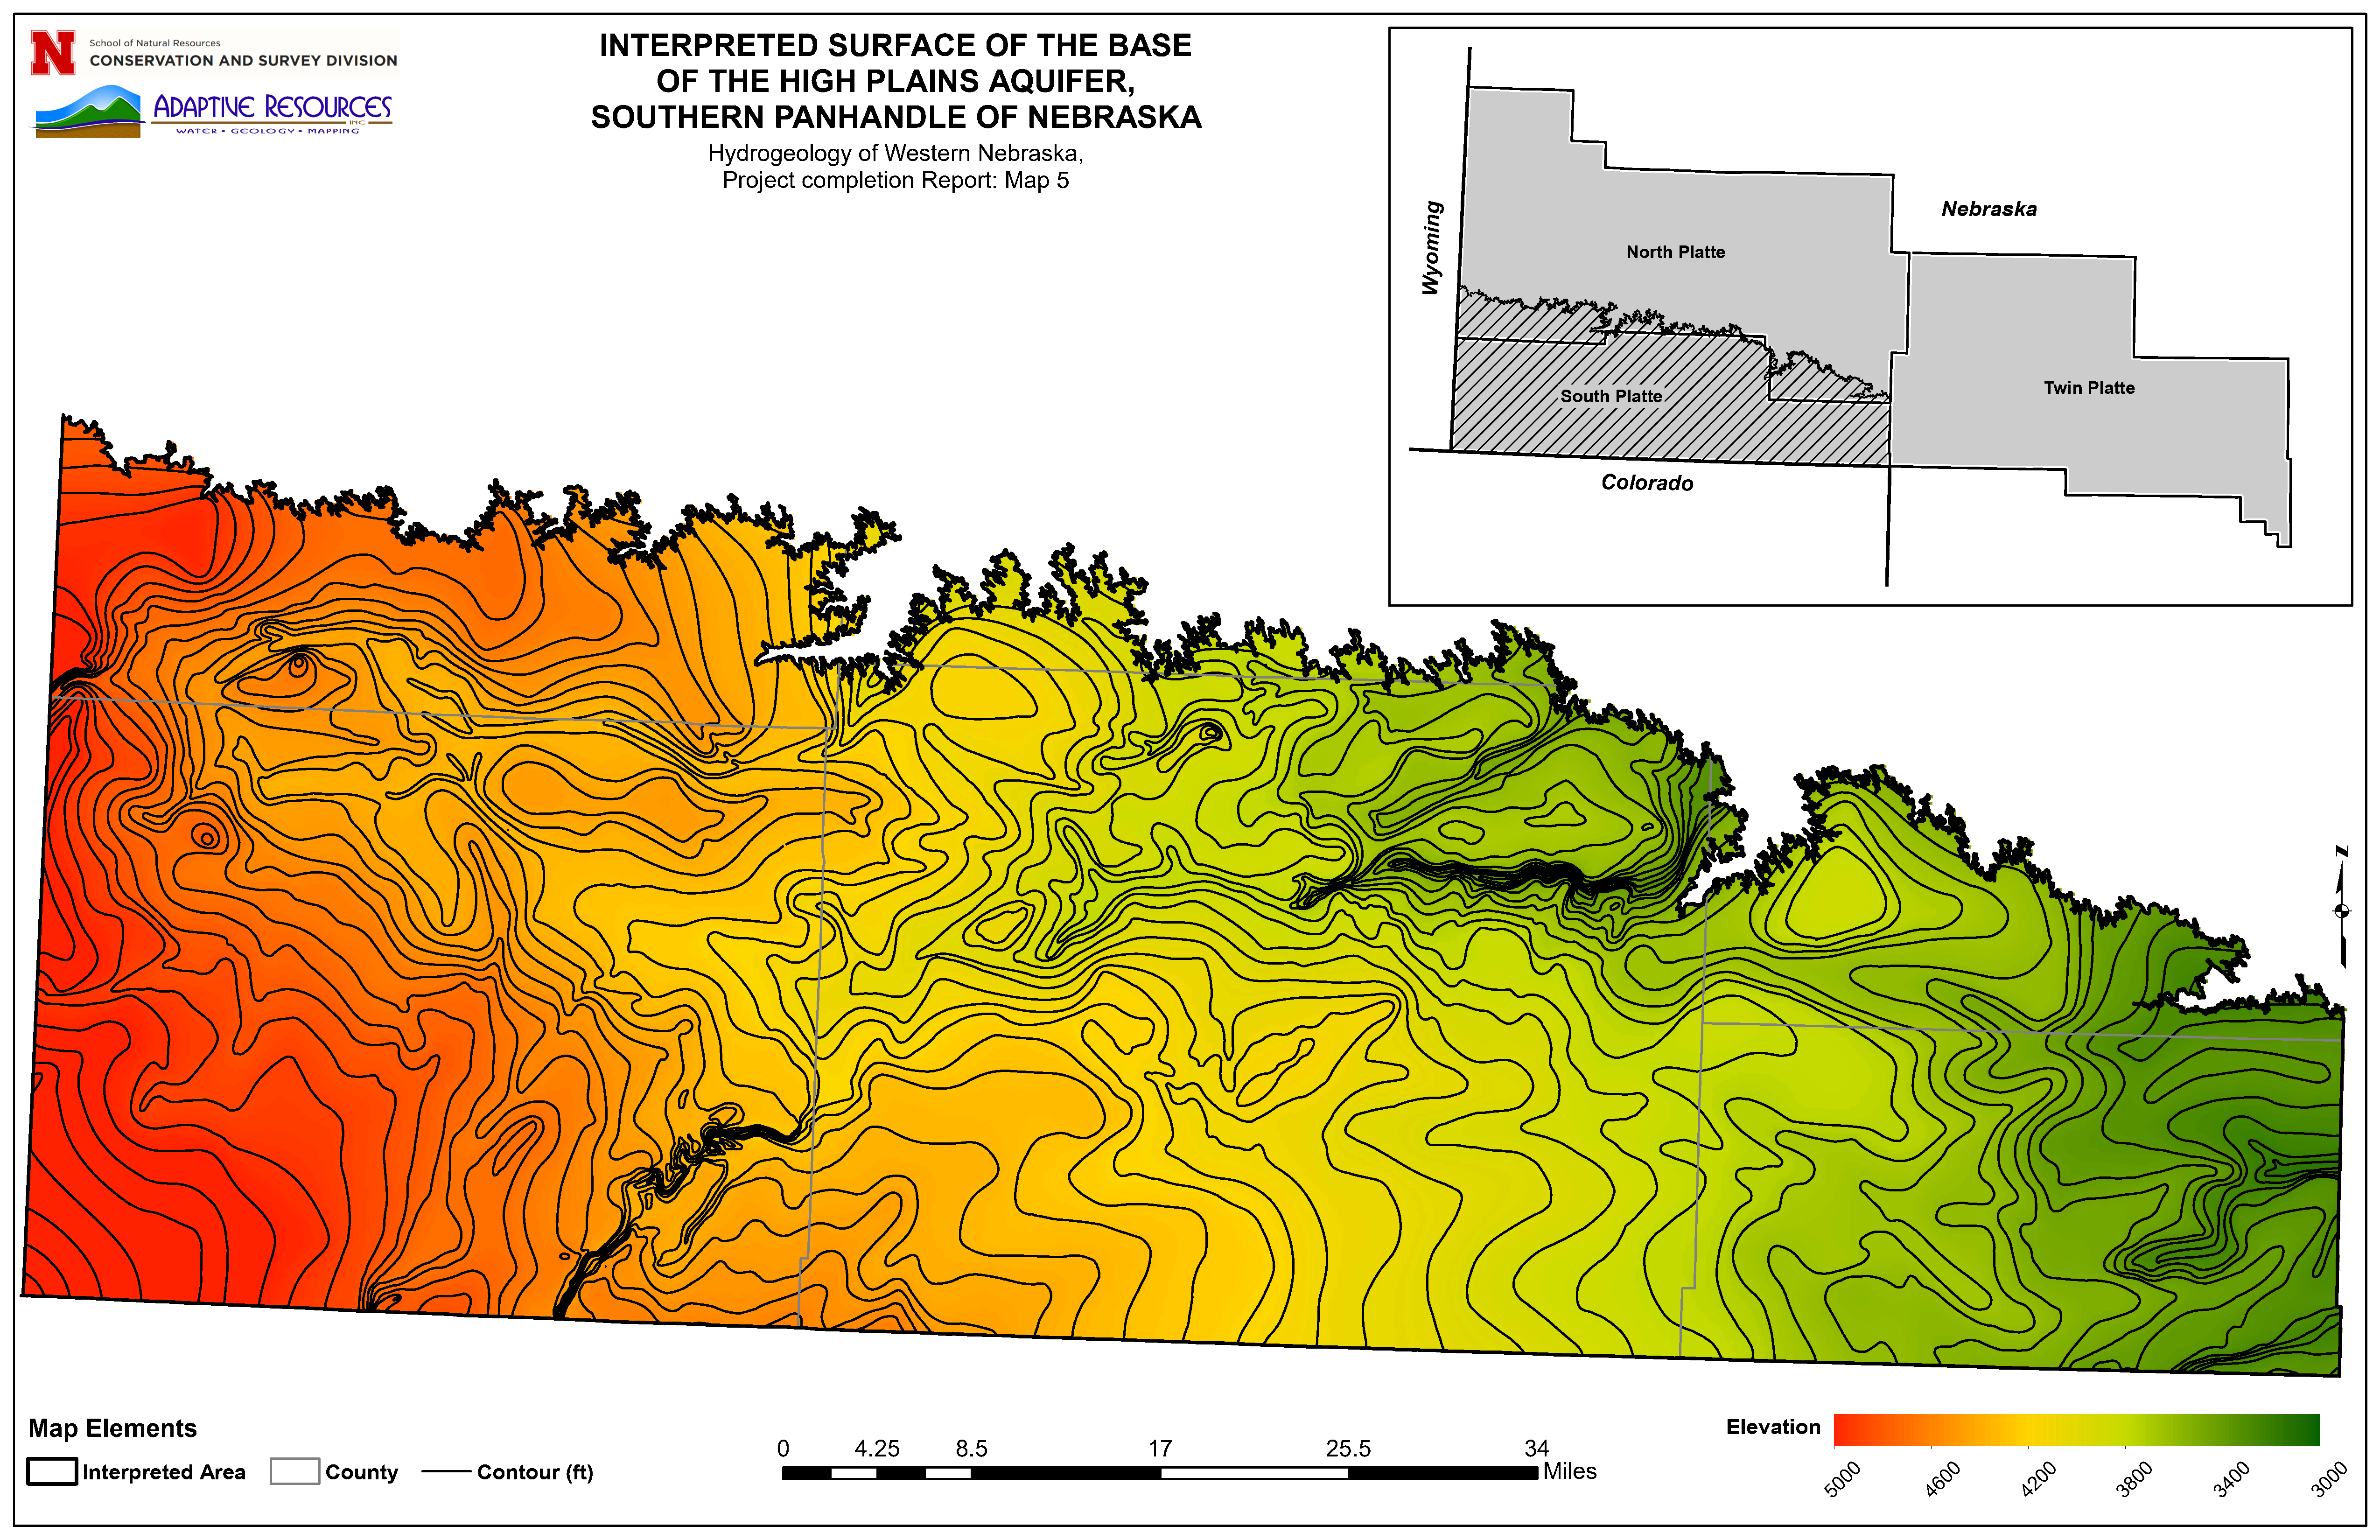
To bring everything together, the study produced one of its most important deliverables: the Interpreted Surface of the Base of the High Plains Aquifer, Southern Panhandle of Nebraska. This stunning contour map shows the elevation of the aquifer’s base across the entire study area with 50-foot contour intervals and a striking color scale — from deep reds and oranges (higher elevations) to vibrant greens (lower elevations). It clearly highlights the dramatic paleochannels and the refined understanding of where the aquifer is thickest and most productive.
The Landmark Interpreted Surface of the Base of the High Plains Aquifer (Map 5 from the 2020 Hydrogeology of Western Nebraska Project Completion Report, Appendix A). This is the capstone deliverable that powers the WWUMM models.
This landmark 2020 study represents a major leap forward in our hydrogeologic knowledge and provides a much stronger and more detailed scientific foundation that powers today’s Western Water Use Management Modeling efforts. It’s a perfect example of how cutting-edge science, collaboration, and curiosity continue to help us protect and manage this precious underground treasure for generations to come.
 Hydrogeology
🌾 Land Use
🌱 ESC Modeling
💧 Ground Water Modeling
📊 Robust Review Analysis
📁 Files & Data
📘 Documentation
Hydrogeology
🌾 Land Use
🌱 ESC Modeling
💧 Ground Water Modeling
📊 Robust Review Analysis
📁 Files & Data
📘 Documentation